Market Daily

Paul Davis Restoration of Tri-County, MD Emphasizes Local Roots and In-House Cost Savings

By: Chloe Martin

Homeowners across Southern Maryland often navigate a restoration project without knowing what to expect from a company they’ve never worked with before. Paul Davis Restoration of Tri-County, MD has built its reputation locally in part by leaning into that familiarity, pairing being a known, community-based business with an in-house structure designed to keep costs down for clients.

A Locally Owned Company That Knows the Region

Owner Jeff McCarthy points to the company’s local roots as central to how it operates day-to-day. “As a locally owned and operated company, we understand the communities we serve and the issues that affect them,” he said. That local knowledge extends into full-service coordination on a project, including managing subcontracts and negotiating directly with insurance adjusters so a homeowner isn’t left tracking down multiple parties on their own. In La Plata, where many properties are managed by owners who don’t have time to coordinate several vendors during a loss, that single point of coordination is treated as a core part of the service rather than an added convenience.

Passing Savings Directly to Clients

McCarthy also points to the company’s internal structure as a pricing advantage. “Through our in-house project management and direct supplier relationships, we focus on finding savings and passing those savings on to our clients,” he said. Rather than marking up costs through layers of subcontractors, the company says its direct supplier relationships and in-house oversight are built specifically to keep those savings visible on a client’s final invoice rather than absorbed along the way.

A Culture Built Around Doing the Right Thing

Beyond the technical and financial side of the business, McCarthy describes the company’s culture in values-based terms. “Our people and this company are anchored on a set of values based on doing the right thing: serving every customer by delivering an experience founded on professionalism, expertise, and compassion,” he said. That framing is meant to guide how technicians handle even small decisions on a job site, not just the major calls that show up in a final invoice.

What Tri-County, MD Clients Are Saying

Recent client feedback consistently highlights the team’s patience and follow-through. GARY M. said Orlando arrived on time after a same-day call, was courteous and patient in answering every question, and even looked into a separate, unrelated issue during the same visit. Dr. Joan M. described extensive water damage discovered in a newly purchased home in Chesapeake Beach, saying the team’s construction and engineering knowledge guided her family’s decisions throughout the repair and even helped install a new window with a full Chesapeake Bay view once the structural work was complete. Desiree M. praised technicians Orlando and Kamari for handling her belongings with white-glove-level care during a water damage cleanup, saying their patience and thorough cleanup made a difficult home deconstruction far more manageable.

Does Paul Davis Restoration Of Tri-County, Md Coordinate Directly With Insurance Adjusters?

Yes. The company negotiates with insurance adjusters and can coordinate subcontracts directly, so homeowners aren’t left managing multiple parties during a claim.

How Does The Company Keep Costs Down For Clients?

Through in-house project management and direct supplier relationships, the company says it captures savings that would otherwise be absorbed by layers of subcontractors and passes them on to clients.

What Values Guide How The Company Operates?

The company describes its culture as centered on professionalism, expertise, and compassion, with an emphasis on doing right by every customer regardless of the size of the job.

What Areas Does Paul Davis Restoration Of Tri-County, MD Serve?

The franchise serves Lexington Park, California, Waldorf, La Plata, Indian Head, Leonardtown, Bensville, Lusby, Prince Frederick, Chesapeake Beach, and Huntingtown, Maryland.

Stay Connected With Paul Davis Restoration of Tri-County, MD

For storm season alerts and project updates, residents can follow Paul Davis Restoration of Tri-County, MD on Facebook and LinkedIn.

Why “Just Apply and See” Is Bad Advice for Business Financing

Business owners exploring financing options often hear the same casual advice: just apply and see what happens. On the surface, this seems harmless, even efficient. In practice, it frequently costs business owners real time, unnecessary stress, and sometimes a meaningful hit to their confidence, all avoidable with a few minutes of preparation beforehand.

The Real Cost of Applying Blind

Submitting an application without any prior sense of qualification means accepting a genuine gamble on the outcome. A business owner who applies blind and gets declined has lost the time invested in that application, and often walks away with little useful information about why, since a decline rarely arrives with a genuine, factor-by-factor explanation. Multiple declines can compound this problem considerably, leaving a business owner increasingly discouraged even if their business has genuinely grown stronger between attempts.

There’s also a quieter cost to this approach: business owners who assume, often incorrectly, that their business isn’t strong enough, and therefore never apply at all. Without any way to check their actual standing, genuinely qualified businesses sometimes avoid pursuing financing they would have easily secured, simply because uncertainty felt like enough of a reason to hold back.

A Better Starting Point Than Guessing

Fundivi, a direct lender and hybrid funding platform, built a free tool specifically to replace this guesswork. The self-underwriting engine lets a business owner enter nine real numbers, revenue, balance, negative balance days, time in business, credit score, state, industry, open positions, and existing payments, and see an immediate, honest outlook with no credit pull and nothing submitted anywhere.

This single step replaces “just apply and see” with something considerably more useful: “check first, then apply with genuine confidence.” A business owner whose numbers clear the published thresholds can move forward knowing their odds are genuinely favorable. A business owner whose numbers fall short on a specific factor gets a clear target to address before trying again, rather than a vague decline with no actionable direction.

Why This Matters Even More When Choosing a Product

The same logic applies to product selection. Applying for a term loan simply because it’s the most familiar structure, without checking whether working capital or a line of credit might genuinely fit better, risks ending up with financing that technically works but doesn’t actually solve the underlying need efficiently. The funding product matcher addresses this directly, walking through eleven questions before recommending the product that actually fits, with the reasoning shown plainly.

Why “Just Apply” Advice Persists Despite the Downsides

This advice endures partly because, for most other kinds of purchases, applying and finding out is genuinely the only practical option available. A consumer applying for a credit card or an auto loan usually has no meaningful way to preview their odds beforehand beyond a general sense of their own credit score. Business financing has historically operated the same way, with underwriting criteria treated as proprietary information rather than something a business owner could check independently in advance.

The advice also persists because it isn’t entirely wrong in every situation. A business owner with an obviously strong, well-established profile may genuinely have little to lose by applying directly, since their odds of approval were always going to be high regardless of any preliminary check. The problem arises specifically for business owners closer to the margin, where a genuine preview of their standing could meaningfully change how, when, or whether they choose to apply at all.

How Preliminary Checking Changes the Actual Decision

Once a business owner has genuine visibility into their own numbers, the decision about whether and how to apply becomes considerably more deliberate. A business owner who discovers their leverage is running high relative to revenue might choose to pay down an existing obligation first, rather than applying immediately and risking a decline tied specifically to that factor. A business owner whose credit score sits just below a clear threshold might choose to wait a few months while making consistent on-time payments, rather than applying today and accepting worse odds than a short delay might have produced.

None of these more deliberate choices are available to a business owner who simply applies and sees what happens. The blind approach forecloses exactly the kind of strategic patience that a few minutes of genuine preparation can unlock, often at real cost to the eventual outcome.

What Changes Once the Guesswork Is Removed

Business owners who check their numbers before applying consistently describe a genuinely different relationship with the entire financing process, one built around informed decision-making rather than hopeful submission. This shift matters beyond just the immediate application at hand, since a business owner who develops the habit of checking their standing periodically, rather than only when a specific need arises, tends to approach every future financing decision with considerably more confidence and strategic clarity.

How This Applies Specifically to Repeat Financing Needs

Business owners rarely need financing only once. A business that successfully secures working capital today will likely face another financing decision months or years down the road, whether for a growth opportunity, a seasonal cash flow gap, or an unexpected expense. Business owners who built the habit of checking their numbers before their first application are considerably better positioned for every subsequent decision as well, since they already understand which specific factors matter most and how their own business’s numbers typically compare against real thresholds.

This ongoing habit becomes particularly valuable for businesses with genuinely seasonal or cyclical revenue, where qualification standing can shift meaningfully throughout the year. A business owner who only ever checked their numbers once, during an unusually strong month, might apply during a genuinely weaker stretch without realizing how much their standing has shifted since that original check, precisely the kind of miscalculation a quick, repeated check would have caught in advance.

Why Lenders Rarely Encourage This Kind of Preparation

It’s worth asking why “just apply and see” remains such common advice when a better alternative genuinely exists. Part of the answer lies in incentives: many lenders benefit from a steady volume of applications regardless of each individual applicant’s actual odds, since even a considerable decline rate doesn’t meaningfully hurt a lender’s business the way it costs the declined business owner real time and effort. A lender with no incentive to reduce its own application volume has little reason to actively encourage business owners to check their odds before applying.

Fundivi’s decision to build and promote free, public tools that might reduce its own raw application volume, by helping some business owners recognize in advance that they’re not yet ready, reflects a genuinely different set of priorities, one that treats a business owner’s time and confidence as worth protecting even when doing so doesn’t maximize the lender’s own short-term application numbers.

Frequently Asked Questions

Isn’t it faster to just apply directly instead of checking first?

Checking first typically takes only a few minutes and can save considerably more time overall by avoiding an application likely to end in decline, or one for the wrong product entirely.

Does checking my numbers first affect my credit score?

No. The underwriting tool and product matcher both perform no credit pull. They calculate entirely from the numbers you enter, with nothing submitted or stored.

What if I check my numbers and the outlook looks weak?

That’s genuinely useful information rather than a discouraging outcome. The tool shows specifically which factor is holding the outlook back, giving you a concrete target to address before applying rather than an unexplained decline afterward.

Is checking first only useful for first-time applicants?

No. Business owners who have been declined before, or whose business has changed since a previous application, benefit considerably from checking their current numbers before assuming a past outcome still reflects where they stand today.

Can I trust the result enough to skip a real application entirely?

The result is a genuinely useful indicative estimate, not a final decision. It’s meant to inform whether and how to move forward with a real application, not to replace one.

Getting Started

Business owners ready to move past guesswork can check their numbers directly, confirm which product genuinely fits their need, and once an offer arrives, use the cost calculator to confirm it’s genuinely fair before signing anything. For a deeper understanding of how each financing option actually works, Fundivi’s guide library covers the details behind every product in plain language.

NFIB Small Business Optimism Index Slips to 98.7 in August as Sales Weaken and Inflation Pressure Persists

The NFIB Small Business Optimism Index fell 1.1 points to 98.7 in August 2026, missing the consensus forecast of 99.3 and reversing most of July’s 2.4-point gain that had pushed the index to its highest reading in a year. The pullback signals that the surge in confidence reported a month ago was narrower than it appeared, driven largely by a temporary improvement in hiring sentiment rather than broad-based momentum across the ten components that make up the index.

Key Takeaways

  • The NFIB Small Business Optimism Index declined to 98.7 in August from 99.8 in July, missing the consensus estimate of 99.3; the index remains above its 52-year average of 98.0.
  • The Uncertainty Index fell 2 points to 89 but remains well above its historical average of 68, reflecting sustained ambiguity around trade policy, inflation, and business expansion timing.
  • NFIB Chief Economist Bill Dunkelberg identified weakened sales, supply chain disruptions, and persistent inflation as the primary headwinds facing small business owners in August.
  • The Employment Index edged down 0.3 points to 101.8 from 102.1 in July; July had seen a seasonally adjusted 36% of owners report unfilled job openings, up 4 points from June and the highest reading since June 2025.
  • The August miss relative to consensus was roughly twice as steep as forecasters expected, suggesting that July’s eight-component improvement overstated the underlying trend.

August Data Reverses July’s Broad-Based Gains Across Index Components

The National Federation of Independent Business released the August results on September 8, 2026. The survey, conducted among NFIB’s membership of small and independent business owners, has tracked monthly sentiment since 1986 and quarterly sentiment since 1973. The index is a composite of ten seasonally adjusted components that collectively capture how small business owners assess their operating environment, including expectations for sales, capital spending plans, hiring intentions, inventory levels, and their outlook for the broader economy.

July’s report had been notably strong. Eight of the ten components improved, pushing the index to 99.8, above its 52-year average of 98.0 for the first time since August 2025. Hiring plans improved substantially and contributed more to the July gain than any other component. A seasonally adjusted 36% of owners reported job openings they could not fill, up 4 points from June and the highest reading since June 2025. That labor market signal, combined with gains across capital expenditure plans and expansion expectations, had prompted some analysts to suggest that small business sentiment was finally stabilizing after months of volatility.

The August data complicates that interpretation. The 1.1-point decline brought the index back below 99, and the miss relative to the 99.3 consensus estimate suggests that forecasters had expected the July momentum to hold. Instead, the reversal points to a familiar pattern in 2026 NFIB data: isolated months of improvement followed by pullbacks, rather than a sustained upward trajectory. The index has not strung together three consecutive months of gains since late 2024.

Inflation, Weak Sales, and Supply Chain Disruptions Drive the Pullback

NFIB Chief Economist Bill Dunkelberg attributed the August decline to a combination of weakened sales, supply chain disruptions, and persistent inflation pressures. Dunkelberg noted that while expectations for the overall economy dimmed, small business owners remained “largely positive in the health of their own businesses.” That divergence between macro pessimism and firm-level confidence has been a recurring feature of the NFIB survey throughout 2026. Owners continue to report adequate demand for their own products and services even as they express doubt about the direction of the national economy.

Inflation has remained a dominant concern for NFIB respondents for more than four years. In earlier 2026 surveys, roughly 20% to 25% of small business owners identified inflation as their single most important problem, consistently ranking it alongside labor quality as one of the top two issues. The persistence of that reading reflects the reality that input costs for small businesses, including materials, freight, insurance, and wages, have remained elevated even as headline consumer inflation has moderated from its 2022 peaks. Small businesses typically lack the pricing power and procurement leverage that larger firms use to absorb or pass through cost increases, leaving them more exposed to sustained input price pressure.

Supply chain disruptions reentered the conversation in August after several months of relative stability. The timing aligns with the escalation in U.S.-Canada trade tensions, which produced new tariffs on both sides of the border. Canada’s retaliatory tariffs on $27.6 billion in U.S. goods took effect on September 8, and the anticipation of those duties may have influenced August survey responses among businesses that import materials from or export goods to Canada. Steel, aluminum, dairy, agricultural equipment, pulp and paper, and electronics are all affected by the new tariff regime.

The Uncertainty Index Remains Elevated Despite a Two-Point Decline

The NFIB Uncertainty Index fell 2 points to 89 in August, continuing a modest decline from its recent peak. The August reading, while lower than July’s 91, remains well above the historical average of 68. The persistent gap between the current reading and the long-term average reflects the degree to which small business owners continue to operate without clear visibility into the policy environment. Trade negotiations between the U.S. and its major partners have produced unpredictable outcomes throughout 2026. Federal Reserve policy under Chair Kevin Warsh has added another layer of ambiguity, with a 9-to-9 split among FOMC participants on the directional outlook for rates and a median fed funds rate projection that has shifted upward since March.

For small business owners weighing expansion decisions, hiring commitments, or capital expenditures, that combination of trade uncertainty and monetary policy ambiguity creates a planning environment in which caution is rational. The Uncertainty Index has remained above 80 for 14 of the past 18 months, a stretch that coincides with the period during which the NFIB Optimism Index has oscillated without establishing a sustained trend in either direction.

The Employment Index Softens After July’s Hiring Surge

The NFIB Employment Index edged down 0.3 points in August, registering 101.8 compared to 102.1 in July. July’s reading had marked an uptick after four consecutive months of decline, driven by a jump in reported job openings and hiring plans. The modest August decline suggests that the labor market signal embedded in July’s data may have been a one-month correction rather than the start of a new hiring cycle.

Labor dynamics remain one of the more complex elements of the small business landscape in 2026. Owners have reported persistent difficulty filling positions for more than two years, but the nature of the problem has shifted. In 2022 and 2023, the primary complaint was the inability to find qualified applicants at any wage. By 2026, the challenge has become more nuanced: applicants are available, but the cost of hiring them, retaining them, and absorbing the associated payroll tax and benefits obligations has risen enough to make owners cautious about adding headcount. That caution is reflected in the Employment Index’s failure to sustain gains above 102 for more than a single month at a time.

The August NFIB data also arrives in the context of broader labor market cooling. The Bureau of Labor Statistics reported that nonfarm payrolls rose by just 57,000 in June, the weakest monthly gain in four months, and private-sector hiring as measured by ADP came in at 98,000 in June, below expectations. Small business hiring sentiment and national payroll data do not always move in lockstep, but both are pointing in the same direction: a labor market that is softening at the margins without collapsing.

FAQs

What Is the NFIB Small Business Optimism Index?

The NFIB Small Business Optimism Index is a monthly composite of ten seasonally adjusted components that measure how small business owners view their operating environment. Published since 1986 by the National Federation of Independent Business, the index covers expectations for sales, hiring plans, capital spending, inventory levels, and the broader economic outlook. The 52-year average sits at 98.0.

Why Did the August 2026 Reading Miss Consensus?

Economists had forecast a modest dip to 99.3, expecting July’s gains to largely hold. Instead, the index fell 1.1 points to 98.7. NFIB Chief Economist Bill Dunkelberg attributed the miss to weakened sales, supply chain disruptions, and persistent inflation pressures weighing on owner expectations for the broader economy.

How Does the Uncertainty Index Compare to Its Historical Average?

The NFIB Uncertainty Index fell 2 points to 89 in August but remains well above its historical average of 68. The index has stayed above 80 for 14 of the past 18 months, reflecting ongoing ambiguity around trade policy, Federal Reserve rate decisions, and the broader regulatory environment affecting small business planning.

Title Search Automation, Understood Correctly: The Human-in-the-Loop Approach That Works

By: KeyCrew Media

Many automation vendors pitching to title companies see real opportunity in title search, and the results come from recognizing it as a blend of production work and judgment work. According to Jimmy Lewis of TrueFocus Automation, understanding this distinction is the single most valuable insight in the industry, and it is one he has refined since he began automating title search workflows around 2000 or 2001.

Why Title Search Rewards a Thoughtful Approach

The current wave of AI-driven automation tools works best, Lewis argues, when it keeps a clear separation between the production work of title search and the judgment work of title examination.

“We still heavily believe in keeping the human in the loop,” Lewis says. “There is a lot of work that can be automated, but we focus typically on the heavy lifting.”

That heavy lifting includes document retrieval, extracting information from those documents, and formatting that information so a searcher or examiner can review it efficiently. These are high-volume, repetitive tasks well suited to automation. The examination itself, the professional judgment about what those documents mean for a property’s title, is where human expertise shines.

The distinction matters because vendors who honor this line deliver a complete solution. They protect title companies by keeping the human expertise that catches what automated systems are not designed to handle.

The Capacity Opportunity Vendors Can Embrace

Lewis frames the value of title search automation as capacity expansion. When automation handles the production-heavy portions of the workflow, experienced searchers and examiners can process significantly more files while maintaining accuracy.

“If we can take 50, 60, 70 percent of that production work off of their hands, they’re able to do two to three times more than they have in the past,” Lewis says.

This reframing shapes how title companies can evaluate automation proposals. A vendor who makes searchers dramatically more productive offers a strong, sustainable path forward, one that keeps expertise available precisely when complex or high-value files call for it.

As more vendors enter the title automation space with tools built on large language models and machine learning, the most reliable approach pairs capable technology with human oversight. Lewis’s position is that the searcher’s expertise is a valuable risk management function that automation should support and strengthen.

Where the Line Is Drawn

Lewis identifies specific parts of the title workflow that benefit from human supervision no matter how capable automation tools become. Title exam and curative work, underwriting, wire releases and disbursements, fraud and identity verifications, and most processes that are considered irreversible all call for contextual judgment that experienced professionals provide.

“They’re the experts, and they need to make the final call,” Lewis says of searchers, examiners and settlement staff.

He acknowledges that this boundary may evolve. “It may be different in a year or two or three. We don’t know,” he says. Building on the current strengths of the technology, while letting it prove new capabilities over time, keeps transactions secure where accuracy carries real financial and legal weight.

For title companies evaluating vendors, Lewis’s framework suggests a practical and constructive question: ask the vendor not only what they can automate, but where they keep the human in the loop. A vendor who can clearly describe the limits of their own tools is offering a solution built around how title work actually gets done.

How TrueFocus Structures Its Workflow

TrueFocus Automation has built its Title Hunter® title search platform around the principle that automation should amplify human capacity and support human judgment. Title Hunter® handles document retrieval and classification, data extraction and doc prep, and an initial QC/fraud check, which tend to be the volume-intensive steps that consume the most time in a searcher's day, while routing the examination and decision-making steps to experienced staff.

Lewis says this architecture has allowed clients to increase throughput while preserving the quality controls that title insurance depends on. “We’re pretty confident that we’ve built the right solution with the human in the loop, and automated as much as we could,” he says. “As of today, title search automation works great on HELOC, Refinance, Loan Mods, and Property Reports files, especially in markets where there is at least 20-30 years of online data available.”

One recent example illustrates the approach at scale. A client was selected to help a customer clear a backlog of roughly 140,000 documents that needed to be recorded. After a few days of manual work to map the flow, TrueFocus built automation that reduced human involvement from roughly eight to nine minutes per document down to about one minute. The remaining time was handled by automation, allowing the client to complete the project without bringing in additional vendor partners.

TrueFocus has drawn a deliberate and thoughtful line between what automation should handle and what it should keep in expert hands. For title companies weighing their options, how a vendor answers the question of where that line falls reveals more than any feature list.

Jimmy Lewis is the CEO & Co-Founder of TrueFocus Automation, a specialist in RPA (robotic process automation) and AI-driven workflow automation for the title insurance, mortgage, and real estate industries. TrueFocus has developed 840+ automation bots supporting more than 2,500 workflows and has returned over 1.3 million production hours to clients.

Disclaimer: This article is intended for informational purposes only and does not constitute legal, financial, or investment advice. The views and opinions expressed herein reflect those of the individuals quoted and do not represent an endorsement of any company, product, or service mentioned. Readers should conduct their own due diligence and consult qualified professionals before making any investment decisions.

U.S. Trade Deficit Jumps 24.4% in July as Record Capital Goods Imports Signal an AI-Driven Spending Surge

The U.S. trade deficit widened 24.4% to $88.6 billion in July 2026, driven by a record-setting surge in capital goods imports as American businesses accelerated spending on computers, semiconductors, and computing accessories tied to artificial intelligence infrastructure. The Commerce Department’s Bureau of Economic Analysis and Census Bureau released the data on September 3, confirming what an advance goods-only report had flagged a week earlier: domestic demand for high-tech equipment is pulling imports into the country at a pace that is outrunning export growth and positioning trade to drag on GDP for a potential fourth consecutive quarter.

Key Takeaways

  • The U.S. goods and services trade deficit widened to $88.6 billion in July from $71.2 billion in June, a 24.4% increase that came in slightly below the Reuters consensus estimate of $90.0 billion.
  • Capital goods imports surged $14.4 billion to a record $140.3 billion, driven by computers, computer accessories, and semiconductors linked to the ongoing AI buildout.
  • Total imports rose 2.8% to $399.3 billion; goods imports climbed 3.7% to $320.6 billion.
  • Exports declined 2.1% to $310.7 billion, with goods exports falling 3.0% to $201.0 billion as industrial supplies and materials shipments dropped $8.7 billion.
  • The goods trade deficit widened 17.3% to $119.6 billion, partially offset by a services surplus of $31.0 billion.
  • Despite July’s spike, the cumulative trade deficit through the first seven months of 2026 is 29.6% smaller than the same period in 2025, with exports up 12.0% year-over-year and imports up only 1.9%.

Capital Goods Tell the Story Behind the Headline Number

The $14.4 billion jump in capital goods imports to $140.3 billion is the single data point that defines July’s report. The increase was concentrated in three categories: computers, computer accessories, and semiconductors. These are the physical inputs of the AI infrastructure cycle that has been reshaping corporate capital expenditure patterns across industries since 2024. When businesses build out data centers, upgrade server capacity, deploy AI training clusters, or integrate machine learning into production workflows, the equipment they purchase flows through the capital goods import line. July’s record reading indicates that the pace of that spending is still accelerating.

Oxford Economics senior U.S. economist Matthew Martin attributed the surge directly to business investment in high-tech equipment tied to the AI boom. The pattern is consistent with second-quarter GDP data, which showed strong business investment alongside robust consumer spending. The demand is real and it is being met, in large part, by foreign manufacturers. The United States designs many of the chips and systems that power AI infrastructure, but the fabrication, assembly, and component manufacturing remain concentrated in East Asia. Taiwan, which posted a $20.7 billion bilateral goods deficit with the United States in July, sits at the center of that supply chain.

Exports Fell as Crude Oil and Gold Shipments Declined

The export side of the ledger moved in the opposite direction. Total exports fell 2.1% to $310.7 billion, with goods exports dropping 3.0% to $201.0 billion. The decline was led by an $8.7 billion contraction in industrial supplies and materials, a category dominated by crude oil and nonmonetary gold. Crude oil exports have been volatile throughout 2026 as the conflict with Iran has disrupted global energy markets and shifted shipping patterns. Nonmonetary gold, which is excluded from GDP calculations, also contributed to the export decline but does not carry the same macroeconomic weight.

Capital goods exports moved in the opposite direction, rising $1.9 billion, and consumer goods exports increased $1.7 billion, lifted by pharmaceutical preparations. The divergence between the capital goods import surge and the more modest capital goods export gain underscores the structural reality of the current cycle: the United States is a net consumer of the hardware that powers AI, even as it remains the leading exporter of the software, services, and intellectual property that sit on top of that hardware.

The Bilateral Deficit Map Reveals Geographic Concentration

July’s bilateral trade data show sharp concentration among a handful of trading partners. Mexico posted the widest bilateral goods deficit at $26.3 billion, reflecting the continued flow of manufacturing output from cross-border supply chains. Vietnam followed at $24.8 billion, a figure that has grown steadily as companies have diversified production away from China. Taiwan’s $20.7 billion deficit is directly tied to the semiconductor supply chain and the AI capital goods surge. For businesses tracking where their supply chain exposure sits, these three markets account for a disproportionate share of the monthly swing.

Year-to-Date Numbers Tell a Different Story Than the Monthly Spike

July’s $88.6 billion deficit is a large number by any monthly measure, but the year-to-date trajectory provides necessary context. Through the first seven months of 2026, the cumulative U.S. trade deficit is 29.6% smaller than it was during the same period in 2025. Exports have grown 12.0% year-over-year, while imports have risen only 1.9%. The broader trend reflects a combination of factors: a weaker dollar through portions of the year that has made American goods more competitive abroad, the impact of tariff-related front-loading in early 2025 that inflated the prior-year baseline, and sustained global demand for American energy, agricultural, and pharmaceutical exports.

The July report, in other words, represents a sharp monthly deterioration within a broader annual improvement. Whether the annual trajectory holds depends in part on what happens to the tariff environment. The Supreme Court struck down reciprocal tariffs in a 6-3 decision in February 2026. RSM US calculates that the average effective tariff currently stands at 16.9%, and full implementation of the court’s ruling could reduce that to 9.1%. A decline of that magnitude would alter the import calculus for businesses that front-loaded inventory earlier in the year to beat tariff deadlines.

Inventory Data Suggest Businesses Are Still Building Buffers

Wholesale inventories for July came in at $959.1 billion, up 1.3% from June and 5.7% higher than July 2025. Retail inventories reached $838.5 billion, up 0.7% month-over-month and 3.8% year-over-year. The combination of rising imports and elevated inventory levels suggests that the import surge is not purely demand-driven. Businesses appear to be hedging against further tariff disruption by stacking goods now rather than risking higher costs or supply chain delays later. If effective tariff rates fall in the wake of the Supreme Court ruling, the incentive to pre-buy diminishes, and the import volumes that inflated July’s deficit may not repeat at the same intensity in subsequent months.

For the GDP calculation, the widening deficit means trade is positioned to subtract from third-quarter growth, potentially marking a fourth consecutive quarter of trade-related drag. The offset, however, is that the same domestic demand powering the import surge, consumer spending and business investment in AI infrastructure, is also the primary engine of GDP expansion. The deficit is a byproduct of strength, not weakness, even if its headline number tells a story that looks like deterioration.

FAQs

Why Did the Trade Deficit Widen So Sharply in July?

The primary driver was a $14.4 billion surge in capital goods imports to a record $140.3 billion, concentrated in computers, computer accessories, and semiconductors tied to AI infrastructure spending. At the same time, exports fell 2.1% as crude oil and industrial supplies shipments declined.

What Does the Trade Deficit Mean for GDP Growth?

A widening trade deficit subtracts from GDP because imports are counted as a negative in the national accounts calculation. July’s data position trade to act as a drag on third-quarter GDP for a potential fourth consecutive quarter. However, the domestic demand driving the imports, including business investment and consumer spending, is simultaneously the primary engine of economic growth.

Is the Trade Deficit Getting Worse Overall in 2026?

On a year-to-date basis, the cumulative trade deficit through July 2026 is 29.6% smaller than the same period in 2025. Exports have grown 12.0% year-over-year while imports have risen only 1.9%. July represents a sharp monthly spike within a broader annual improvement.

Which Countries Account for the Largest Bilateral Deficits?

In July 2026, Mexico posted the widest bilateral goods deficit at $26.3 billion, followed by Vietnam at $24.8 billion and Taiwan at $20.7 billion. Taiwan’s deficit is closely tied to the semiconductor and AI hardware supply chain.

Why Poster Printing Is Having a Moment in a City That Never Stopped Needing It

There is a running assumption in marketing circles that print is losing ground to digital. The data on poster printing specifically tells a different story, and New York City is one of the clearest illustrations of why physical materials are not going anywhere. The global poster design market was valued at $9.37 billion in 2025 and is projected to reach $14.5 billion by 2030, growing at a compound annual growth rate of 9.2 percent, driven by expanding event marketing activity, rising demand for corporate branding materials, and the continued role of offline advertising channels in reaching audiences that digital campaigns frequently miss. That growth is not happening despite digital media. It is happening alongside it, because the two formats reach different people in different contexts, and businesses that rely exclusively on one are consistently leaving reach on the table.

In New York, the case for poster printing is specific. The city runs thousands of events, exhibitions, and brand activations every year. Venues from the Javits Center to hotel conference rooms in Midtown to pop-up spaces in Williamsburg all have one thing in common: they need physical materials, and those materials need to be ready before the doors open.

What Poster Printing Actually Gets Used For

Photo Courtesy: Unsplash.com

The use cases for professional poster printing in New York span a wider range than most people picture when they hear the word.

  • Event and Venue Signage – Directional signage, welcome boards, speaker introduction panels, and sponsor acknowledgment walls are all poster-format materials that event planners source regularly. These are not creative projects in the traditional sense. They are logistical ones, and getting them to the right venue in the right condition before setup time is what a reliable printing company makes possible.
  • Retail and Storefront Promotion – Window posters, in-store promotional graphics, and seasonal campaign materials cycle through New York retail environments continuously. For a store running a promotion that starts this weekend, printing services that operate on a same-day or next-day timeline are often the only practical option.
  • Corporate and Presentation Materials – Presentation boards, mounted graphics for pitch meetings, and branded backdrop panels for corporate photography all fall into this category. These are produced in smaller quantities than event signage but carry a higher standard for finish quality, since they appear in close-up settings where imperfections are visible.
  • Cultural and Arts Programming – New York’s gallery openings, theatre productions, film screenings, and community events generate a consistent volume of poster orders from organizations that typically work on tight budgets and tighter timelines.

Poster Printing Size and Cost Reference

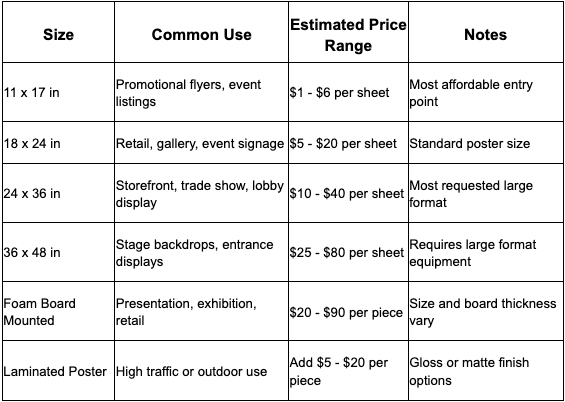
Pricing depends on paper stock, finish, size, and whether mounting or lamination is included. Below is a general reference for New York market rates:

Photo Courtesy: Unsplash.com

Pricing is based on general NYC poster printing market rates (2025-2026). Rush and same-day surcharges apply when applicable.

Why Local Printing Beats Shipping in New York

Teams traveling to New York for events frequently run into the same problem: materials printed elsewhere arrive damaged, arrive late, or do not match what was approved on screen. A local printing company with same-day capability solves all three of those problems simultaneously.

Print Banners NYC handles poster printing in New York across standard and large format sizes, and their team reviews files before production rather than after, which is the step that catches dimension errors and color mode issues before they become a wasted run. Beyond banners, they cover the full range of poster formats that event planners, retailers, and corporate teams regularly need on short notice. For orders with a hard deadline, their same-day and rush turnaround options mean a confirmed print can be in hand the same day the file is approved, without the uncertainty that comes with shipping from an out-of-city print house.

The Detail That Determines the Result

Photo Courtesy: Unsplash.com

Paper stock choice affects every other variable in a poster print. A lightweight uncoated stock works for internal signage and event listings where the budget matters more than the tactile impression. A heavy gloss or silk-coated stock changes how color renders and how the poster reads in a lit environment. Mounted or laminated finishes determine how long the poster holds up in a high-traffic setting.

Getting this conversation right with a printing service before the order goes to production is the difference between a result that works and one that has to be reprinted.

Sources: The Business Research Company, Poster Design Global Market Report 2026 (July 2026); Grand View Research, U.S. Commercial Printing Market Report 2025 (April 2026); general NYC poster printing market rate data (2025-2026)

This article was developed in partnership with SEO GURU, a full-service digital marketing agency specializing in local SEO, web development, and performance-driven Google AdWords campaigns for businesses across the New York metropolitan area

SEO Content Writing Services from Author Path Publishers

Your site is live, it looks decent, and almost nobody arrives who was not already looking for you by name. Everyone says the answer is content, but nobody explains which content, in what order, or how long before it does anything. That is the gap seo content writing services are meant to close, and where a lot of money gets spent badly. Author Path Publishers writes web copy for authors, coaches and small businesses on a simple principle: work out what a real person is trying to find, then be the best answer they land on.

Search Intent Comes Before the Keyword

Two people can type nearly the same phrase and want completely different things. One wants a definition, one a comparison, one wants to hire somebody today. Writing a long explainer for a phrase people search when they are ready to buy is an expensive mistake, and so is putting a sales page in front of someone who only wants to understand a term.

The first step is reading the results already ranking for a phrase and asking what they have in common. If every result is a step-by-step guide, that tells you what searchers accepted as a good answer. Your page can be better or clearer than those, but it has to answer the same underlying question.

Keyword Research That Ends in a Page Map

Research is not a spreadsheet of a thousand phrases. It is a shortlist of topics your audience genuinely searches, grouped so that each cluster points at one page and one page only. When three articles chase the same phrase, they compete and none of them wins.

The output is a map: this phrase belongs to the service page, this cluster becomes a guide, this narrow question becomes a short post linking back to the main page. Keyword optimized content works because of that assignment, not because a phrase has been repeated a fixed number of times. Stuffing a term into every paragraph reads badly and has been ignored by search engines for years.

Blog Posts and Service Pages Are Not the Same Job

A service page has to convince. It states plainly what you do, who it is for, what happens when someone gets in touch, and how pricing is decided. Good content writing for websites puts that information above the fold rather than three scrolls down, because a visitor deciding whether to trust you will not hunt for it.

Articles do a different job. SEO article writing brings in people who do not know you yet and have a question you can answer properly, which is why SEO blog writing services are usually the slower, larger half of the work. Both need to be readable first. If the page only makes sense to a search engine, the traffic arrives and leaves.

Internal Links and the Posts You Already Published

Internal linking is the least glamorous and most reliably useful part of the job. Every new article should point to the service page it supports, using plain descriptive wording rather than “click here”, and older posts should be updated to point at the new one. That is how scattered pages become a body of work.

Refreshing what you already have often beats writing something new. An article two years old with outdated advice, dead links and a thinner answer than its rivals can usually be rebuilt in a fraction of the time a new piece takes, and it keeps the history it has already earned. Author Path Publishers treats an audit of existing pages as the first task on most projects.

What SEO Content Writing Services Can and Cannot Promise

Here is the honest part. Nobody can guarantee rankings. Search engines do not sell positions, their systems change without notice, and any provider promising a number one spot is either misinformed or hoping you are. What can be committed to is the work: research, well made pages, clean structure, and consistent publishing.

Expect months rather than weeks. New sites and competitive terms take longer, and progress usually shows first in small signals, such as impressions rising or a page appearing for phrases you never targeted. Measure against where you started, review every quarter, and change the plan when the evidence says to.

Let Author Path Publishers Write the Pages That Get You Found

The SEO content writing services at Author Path Publishers are built for authors and small businesses who want their websites working, not just existing. You get a keyword map tied to real pages, service copy that explains your offer clearly, articles worth reading, an internal linking plan, and a refresh schedule for older material. You get flexible pricing set out plainly, round-the-clock support, and an introductory discount of up to 50% on new projects.

U.S. Private Payrolls Add 38,000 Jobs in August as Hiring Slows to Lowest Pace Since January

U.S. private-sector employers added 38,000 jobs in August, the slowest monthly pace of hiring since January 2026, according to the ADP National Employment Report released on September 2. The figure fell short of both the Dow Jones consensus estimate of 47,000 and the Reuters forecast of 48,000. July’s gain was revised upward to 46,000 from an initially reported 44,000. The report, produced in collaboration with the Stanford Digital Economy Lab, arrives two days ahead of the Bureau of Labor Statistics nonfarm payrolls report for August, which economists project will show a gain of 55,000 jobs after July’s contraction of 23,000.

Key Takeaways

  • Private-sector employment increased by 38,000 in August, missing the 47,000 Dow Jones consensus and the 48,000 Reuters forecast; July was revised upward to 46,000 from 44,000
  • Education and health services led all sectors with 45,000 jobs added; manufacturing shed 17,000 jobs and professional and business services lost 16,000
  • Large businesses with 500 or more employees added 34,000 positions; small businesses with 1 to 19 employees added 20,000; mid-size small businesses with 20 to 49 employees lost 17,000
  • ADP Pay Insights reported median base pay up 3.2% year-over-year for all private-sector workers; gross pay, which includes bonuses, commissions, and tips, rose 4.7%
  • Job-changers saw base pay increases of 4.7% compared to 3.0% for job-stayers; gross pay for job-changers rose 7.3% versus 4.4% for those who remained in their positions
  • The Bureau of Labor Statistics nonfarm payrolls report is scheduled for Friday, September 4; economists expect 55,000 jobs added after July’s 23,000 contraction

Sector Performance Split Sharply Between Services Growth and Goods-Producing Contraction

The August data reveals a labor market that is still generating jobs but doing so unevenly across industries. Service-providing businesses added 48,000 positions, carrying the entire net gain and then some. Education and health services accounted for 45,000 of those jobs, a figure that reflects the structural demand for workers in healthcare delivery, K-12 education staffing, and higher education administration heading into the fall semester. Leisure and hospitality added 16,000 jobs, financial activities contributed 6,000, and construction added 12,000.

The goods-producing side of the economy moved in the opposite direction. Manufacturing lost 17,000 jobs, continuing a pattern of contraction that has persisted through much of 2026 as elevated input costs, energy prices, and supply chain disruptions tied to the Middle East conflict have pressured margins and slowed order volumes. Professional and business services, a category that includes consulting, staffing agencies, and technology services, shed 16,000 positions. Goods-producing businesses as a whole contracted by 10,000 jobs in August.

The divergence between services and goods-producing employment is a data point that matters for small business owners operating in manufacturing, logistics, and professional services. The sectors adding jobs, healthcare and hospitality, are labor-intensive industries with persistent structural demand. The sectors losing jobs are more sensitive to credit conditions, energy costs, and business confidence, all of which the Federal Reserve’s September 2 Beige Book flagged as areas of elevated uncertainty.

Small Business Hiring Diverges by Size Band

The ADP data segments hiring by employer size, and the August numbers tell a split story for small businesses. Firms with 1 to 19 employees added 20,000 jobs, a figure that suggests the smallest employers are still finding demand sufficient to justify new hires. But mid-size small businesses, those with 20 to 49 employees, lost 17,000 positions. Businesses with 50 to 249 employees shed 3,000 jobs, and firms in the 250 to 499 range cut 16,000.

Large employers with 500 or more workers drove the majority of August’s net hiring, adding 34,000 positions. That concentration of hiring among the largest firms aligns with a pattern that has been visible throughout 2026: large employers have more capacity to absorb elevated input costs and more flexibility to restructure operations, while mid-size businesses operate with thinner margins and less room to carry headcount through periods of uncertainty.

For businesses in the 20 to 49 employee range, the 17,000-job loss is a signal worth tracking. This cohort represents companies that have moved beyond the startup phase but have not yet reached the scale where fixed overhead can be distributed efficiently across a larger revenue base. These are firms that tend to feel the effects of tightening credit conditions, rising commercial insurance premiums, and wage competition from larger employers more acutely than either the smallest sole-proprietor operations or the largest enterprise businesses.

Pay Growth Remains Positive but the Gap Between Job-Changers and Job-Stayers Continues to Widen

Beginning with the August 2026 release, ADP Pay Insights expanded its reporting to include year-over-year changes in contracted base pay rates alongside its existing gross pay data. The distinction matters because gross pay includes bonuses, commissions, tips, and overtime, all of which can fluctuate with business conditions and seasonal demand. Base pay reflects the contracted rate an employer has agreed to pay a worker, which is a more stable indicator of underlying wage dynamics.

For all private-sector workers, median base pay rose 3.2% year-over-year in August. Gross pay, which captures total compensation including variable earnings, rose 4.7%. The gap between the two figures suggests that while contracted wages are growing modestly, a meaningful portion of total pay growth is being driven by variable compensation components rather than permanent rate increases.

The spread between job-changers and job-stayers remains the most telling data point in the pay analysis. Workers who changed jobs saw base pay increases of 4.7%, compared to 3.0% for those who remained in their positions. On the gross pay side, job-changers earned 7.3% more than a year ago, versus 4.4% for stayers. That 1.7-percentage-point gap in base pay and 2.9-point gap in gross pay reflects a labor market where mobility is still being rewarded financially, but where employers are not raising wages at the same pace for their existing workforce.

ADP Chief Economist Nela Richardson framed the data in terms of the structural forces shaping hiring: demographic change, persistent inflation, and AI’s effects on jobs. Richardson noted that once-predictable wage growth patterns have been disrupted by these overlapping pressures, making traditional hiring metrics less reliable as standalone indicators of labor market health.

The Report Arrives Against a Backdrop of Conflicting Economic Signals

The ADP employment data landed on the same day the Federal Reserve released its September Beige Book, which reported that economic activity increased modestly since early July across 10 of 12 Federal Reserve districts. The Beige Book noted that employment rose very slightly overall, with five districts reporting no change in headcount, and that input cost pressures were elevated in manufacturing and construction due to energy, raw materials, and transportation costs.

The alignment between the ADP and Beige Book findings reinforces a picture of an economy that is still growing but doing so at a pace that is not generating strong job creation. For entrepreneurs and small business owners, the practical implications center on three variables: hiring is slowing, wage pressure from job-changers is not abating, and the sectors contracting, manufacturing and professional services, are ones where many mid-size businesses operate.

The NFIB Small Business Optimism Index, released on August 11, offered a somewhat more encouraging signal. The index rose 2.4 points in July to 99.8, crossing above its 52-year average of 98.0 for the first time since August 2025. Hiring plans improved substantially and were the primary driver of the index increase. However, the NFIB Uncertainty Index also rose to 91, well above its historical average of 68, suggesting that while small business owners are planning to hire, they are doing so with limited visibility into how conditions will evolve over the next two quarters.

Friday’s BLS Report Will Provide the Official Labor Market Picture

The ADP National Employment Report and the Bureau of Labor Statistics nonfarm payrolls report use different methodologies and frequently diverge in both direction and magnitude. ADP’s data is derived from anonymized weekly payroll records of its corporate clients, covering more than 26 million private-sector employees. The BLS survey covers both the private sector and government employment and uses a different sampling methodology.

Economists surveyed ahead of Friday’s BLS release expect nonfarm payrolls to show a gain of 55,000 jobs in August, a rebound from July’s contraction of 23,000. The July decline was widely attributed to seasonal adjustment noise and temporary disruptions rather than a structural shift in the labor market. If the BLS report confirms a rebound in line with expectations, the August ADP miss may be interpreted as a sector-specific softening rather than a broad labor market deterioration.

For business owners planning Q4 headcount, the ADP data suggests that the window for hiring at modest wage premiums may be narrowing in sectors where demand remains strong, while industries facing cost pressures are already pulling back. The 3.2% base pay growth figure provides a benchmark for compensation planning: employers matching or exceeding that rate are operating in line with the market, while those offering less risk losing workers to competitors willing to pay the job-changer premium that currently sits at 4.7%.

FAQs

How Many Private-Sector Jobs Were Added in August 2026?

The ADP National Employment Report recorded 38,000 private-sector jobs added in August, below the Dow Jones consensus estimate of 47,000 and the Reuters forecast of 48,000. July’s figure was revised upward to 46,000 from an initially reported 44,000. August represents the slowest pace of private payroll growth since January 2026.

Which Sectors Added the Most Jobs in August?

Education and health services led all sectors with 45,000 jobs added. Leisure and hospitality contributed 16,000, construction added 12,000, and financial activities added 6,000. Service-providing industries collectively added 48,000 positions, while goods-producing businesses contracted by 10,000.

Which Sectors Lost Jobs in August?

Manufacturing lost 17,000 jobs and professional and business services shed 16,000 positions. Goods-producing businesses as a whole contracted by 10,000 jobs. The losses reflect ongoing pressure from elevated energy and input costs, tightening credit conditions, and supply chain disruptions linked to the Middle East conflict.

How Fast Are Wages Growing According to ADP?

Median base pay for all private-sector workers rose 3.2% year-over-year in August. Gross pay, which includes bonuses, commissions, and tips, rose 4.7%. Job-changers saw base pay increases of 4.7% compared to 3.0% for workers who stayed in their current positions. Gross pay for job-changers rose 7.3% versus 4.4% for job-stayers.

When Is the BLS Nonfarm Payrolls Report for August?

The Bureau of Labor Statistics is scheduled to release its nonfarm payrolls report for August on Friday, September 4. Economists expect the report to show a gain of 55,000 jobs after July’s contraction of 23,000. The BLS report covers both private-sector and government employment and uses a different methodology than the ADP report.

What Does the ADP Report Mean for Small Business Hiring?

Small businesses with 1 to 19 employees added 20,000 jobs in August, while mid-size small businesses with 20 to 49 employees lost 17,000. The divergence suggests that the smallest employers are still finding demand sufficient to hire, but firms in the growth stage between 20 and 49 employees are pulling back amid elevated costs and competitive wage pressure from larger employers.

Workforce Shortages and Professional Development in the Applied Behavior Analysis Field in the United States

Applied Behavior Analysis has rapidly developed in the US, increasing demand for personnel in the field. This is relevant to those who develop treatment strategies and those who work directly with patients. In addition, a significant number of Board Certified Behavior Analysts supervise treatment teams of Registered Behavior Technicians. These two kinds of professionals are growing exponentially, and demand continues to increase. According to the Behavior Analyst Certification Board report from July 1st 2026, there were 85,587 BCBAs and 260,174 RBTs.

The employment data shows how quickly the market has changed. The Behavior Analyst Certification Board used Lightcast data from more than 65,000 sources to track job postings between 2010 and 2025. Postings requiring or preferring BCBA or BCBA-D certification reached 132,307 in 2025, up 28% from 103,150 in 2024. The same report found that demand had increased every year since 2010. California, New Jersey, Texas, Massachusetts, and North Carolina accounted for 38% of recent demand, with California alone representing 15% of 2025 postings. The figures do not measure vacancies directly, but they show that employers have continued to seek qualified behavior analysts.

The supply of new professionals has also grown. In 2025, the BACB reported 8,021 newly certified BCBAs and 82,681 newly certified RBTs. At the end of that year, 81,566 people held BCBA certification and 246,109 held RBT certification. RBT certification has become an important entry point because the role requires less formal education than BCBA certification. The BACB recorded 109,341 first-time RBT examination candidates in 2025, with a 75% pass rate. For BCBAs, 9,955 people took the examination for the first time, with a 51% pass rate. The numbers illustrate a growing training pipeline, although certification totals alone cannot show where shortages remain.

Workforce supply also differs by location. The BACB’s 2025 employment report recorded 20,258 BCBA-related postings in California, compared with 8,139 in New Jersey and 7,792 in Texas. North Carolina recorded 6,874 postings, while Massachusetts recorded 7,315. Some states saw large year-to-year increases, including South Carolina, where postings rose 102%, and Utah, where they increased 94%. Other states recorded declines. These differences matter because autism treatment providers cannot assume that a national rise in certification will translate into equal access to workers in every area. Recruitment can remain difficult even when the overall number of certified professionals rises.

RBT retention presents another challenge. A 2024 study involving 11 RBTs in Florida examined factors linked to burnout and turnover. The researchers identified concerns involving competency, working conditions, career prospects, and pay and benefits. They also found that experiences differed between organizations. The study did not establish a single national turnover rate, but it provides a closer view of problems reported by workers in direct-care roles. RBTs often work closely with clients for long periods, making training, supervision, scheduling, and workplace support relevant to both staff retention and service delivery.

Supervision creates a separate pressure on the profession. BCBAs do not only provide clinical services. They also supervise technicians, review treatment data, guide intervention plans, train staff, and complete required documentation. As the number of RBTs rises, providers need enough experienced analysts to supervise them. This creates a pipeline problem when newer BCBAs enter a field that itself needs more senior clinicians. The BACB has continued to publish resources on supervised fieldwork and training requirements, reflecting the role supervised experience plays in professional development. Workforce growth, therefore, involves more than producing new certificates. It also requires enough qualified supervisors to support people entering the profession.

Universities and employers have responded by building closer links between academic study and clinical practice. Practicum placements allow students in graduate behavior analysis programs to complete supervised fieldwork while working with clients. These arrangements can help students connect classroom learning with clinical work before they seek certification. They also give providers access to people already pursuing BCBA credentials. Such partnerships have become one part of the wider effort to build the profession’s workforce rather than relying only on outside recruitment.

Success On The Spectrum has developed its own career pathway around this model. Founded by Nichole Daher, the organization says it provides entry-level Behavior Technician training, pays for a 40-hour RBT certification course, and offers supervision for staff pursuing certification. Its career information also describes weekly team training, quarterly in-service sessions, and performance reviews for RBTs. Employees can move through several internal levels before entering training toward more advanced roles. These details come from the company’s own materials and describe its stated workforce strategy rather than an independent assessment of its results.

The organization also reports partnerships with universities that provide practicum opportunities and tuition discounts for employees. Its published list includes Purdue Global University, Florida Institute of Technology, Nova Southeastern University, Capella University, St. Edward’s University, Pepperdine University, Felician University, Utah Valley University, York College, and the University of Cincinnati. The company says it is an approved practicum site for more than eight universities and provides paid internships with supervision from BCBAs. Its career pathway runs from Behavior Technician and RBT roles to BCaBA, BCBA intern, BCBA, and management positions.

The model also extends to professionals who have already entered the field. Success On The Spectrum states that newly hired BCBAs receive two weeks of corporate training, monthly training meetings, and an annual continuing education allowance. It also says an intern assists each BCBA and carries a maximum caseload of 12 full-time clients under its stated employment model. These figures describe the organization’s published policies and should not be treated as industry-wide standards. They show how one franchise operator has attempted to connect recruitment, supervision, training, and advancement within a single system.

The workforce question remains broader than any single provider. According to the BACB, demand for behavior analysts has increased steadily over its 16-year database; however, research on RBTs indicates retention challenges that could negatively affect direct care staff. For employers, universities, the behavioral profession, and training organizations, this means it is a common challenge to increase the number of qualified workers while ensuring sufficient supervision and practice. Success On The Spectrum is one organization taking this initiative through entry-level training, internships, university collaborations, and career paths.

Paul Davis Restoration of Southeast Missouri, Carbondale & Paducah Builds Projects Around Clear Schedules and Genuine Care

By: Olivia Hughes

A restoration project can feel less overwhelming when a homeowner has a clearer sense of what to expect and when. Paul Davis Restoration of Southeast Missouri, Carbondale & Paducah says it has built its process around that idea, pairing structured project scheduling with an emphasis on personal connection from the very first call.

Personal Connection From the First Call

Owner Gregg Garland describes the company’s approach to a new client relationship in warm terms. “We build personal connections with every customer, bringing genuine warmth, compassion, and a sense of relief from the very first phone call,” he said. That tone is meant to carry through the entire project, not just the initial conversation. “Every project is approached as a partnership, with the goal of not just meeting but exceeding expectations,” Garland added. In Poplar Bluff, one of the communities across the tri-state service area, that partnership approach applies the same way whether the job is a small residential repair or a larger commercial loss.

Clear Schedules Shared Upfront

The company also points to project scheduling as a specific area where it places emphasis. “We build clear project schedules, share them upfront with customers, and use project management software to track milestones and progress,” Garland said, describing an approach designed to reduce the kind of missed timelines and vague expectations that often frustrate homeowners working with a restoration company for the first time.

That same structure can apply whether a project stays within emergency mitigation or expands into full reconstruction and remodeling, since the company describes its team as supporting each phase from mitigation through reconstruction.

What Clients Across the Tri-State Area Are Saying

According to recent client feedback shared by the company, responsiveness and follow-through are common themes. Kyle F. said the team handled repairs after a home break-in with strong communication between himself and the builders involved, calling the entire experience a job well done. Linda D. described the team as very professional throughout a project, saying the finished result looked great and that she would recommend them to anyone needing restoration services. Amy S. praised the office staff for their kindness and courtesy, adding that every message or call was returned in a timely manner throughout her project.

Across all three reviews, a similar thread comes up repeatedly: clients felt informed at each stage rather than left guessing about what would happen next.

How does Paul Davis Restoration of Southeast Missouri, Carbondale & Paducah build trust with new clients?

The company emphasizes warmth and personal connection from the first phone call, treating each restoration project as a partnership rather than a transaction.

Does the company provide a clear project timeline?

Yes. The team says it builds project schedules upfront, shares them with clients and uses project management software to track milestones and progress throughout a job.

What areas does Paul Davis Restoration of Southeast Missouri, Carbondale & Paducah cover?

The company serves a tri-state region spanning southeast Missouri, southern Illinois and western Kentucky, including Poplar Bluff, Cape Girardeau and Sikeston in Missouri, Carbondale and Marion in Illinois and Paducah in Kentucky.

Does the company work with insurance carriers directly?

The company says it coordinates with insurance carriers throughout a project to help streamline documentation and claims processing.

Stay Connected With Paul Davis Restoration of Southeast MO, Carbondale & Paducah

For project updates and local news, homeowners and businesses can follow Paul Davis Restoration of Southeast Missouri, Carbondale & Paducah on Facebook and LinkedIn.