Market Daily

September Flash PMI Hits Five-Year High as Input Cost Inflation Reaches Highest Level Since 2022


U.S. business activity grew at its fastest pace in more than five years in September. The S&P Global Flash US Composite PMI rose to 58.4 from 56.0 in August. Input costs rose at the fastest rate since October 2022, driven by fuel and transport expenses, adding to inflation pressure the Federal Reserve is already trying to contain.

Key Takeaways

  • The Flash US Composite PMI Output Index reached 58.4 in September, a 62-month high and the fourth consecutive month of faster growth.
  • The Flash US Manufacturing PMI jumped to 57.0 from 53.9, the strongest improvement in factory conditions since May 2022.
  • The Services Business Activity Index rose to 58.7 from 56.5, a 59-month high.
  • Employment rose at the fastest rate since June 2022, and manufacturing payrolls grew at the fastest pace since February 2021.
  • Backlogs of uncompleted orders rose at the sharpest rate since May 2022, and supplier delays were the most widespread since July 2022.
  • Final September manufacturing data will be published October 1, with services and composite data following on October 5.

The Headline Numbers Show Broad-Based Acceleration

The September flash PMI showed gains in both major sectors. The S&P Global Flash US Composite PMI Output Index, a weighted average of manufacturing output and services activity, rose 2.4 points to 58.4. Readings above 50 indicate expansion. September’s level marks the fastest growth since July 2021.

Services led the increase. The Services Business Activity Index climbed to 58.7 from 56.5, the steepest rise in output in more than five years. Manufacturing also recovered. The Manufacturing Output Index rose to 56.7 from 53.1, its fastest reading since April 2022, after three months of slowing production growth.

The headline Manufacturing PMI, which combines new orders, output, employment, supplier delivery times, and inventories, rose to 57.0 from 53.9. S&P Global said all five components contributed to the gain. New orders in manufacturing grew at the fastest pace in nearly four and a half years.

Chris Williamson, Chief Business Economist at S&P Global Market Intelligence, said the data point to annualized economic growth of around 5% and a 4% gain for the third quarter overall. Excluding the post-lockdown rebound, he said the improvement in business activity is the largest recorded since early 2015. “Business is clearly booming now in both manufacturing and services,” Williamson said.

Domestic Demand Is Driving the Growth

The composition of demand matters for business owners reading the September PMI. New order growth reached its highest level since March 2022 in services and since April 2022 in manufacturing. S&P Global said the growth came mainly from the domestic market. Goods export volumes continued to fall, and services exports rose only modestly.

That pattern suggests U.S. growth is being driven by domestic spending, not overseas demand. Businesses selling to U.S. customers are seeing stronger order books. Exporters face a weaker picture, and a stronger dollar in recent sessions could add to that pressure.

Capacity Constraints Are Starting to Show

The September PMI also points to strain on operating capacity. Backlogs of uncompleted orders, which S&P Global treats as a key measure of capacity use, rose at the sharpest rate since May 2022, with increases in both manufacturing and services.

Companies responded by hiring. Employment rose at a pace rarely exceeded since comparable data began in 2009. Service sector payrolls grew at the fastest rate since June 2022, and factory employment rose the most since February 2021. Even so, companies reported growing difficulty finding suitable staff.

Supply chains added to the pressure. Suppliers’ delivery times lengthened sharply again, with delays the most widespread since July 2022. Williamson said the bottlenecks are among the most severe in the survey’s nearly 20-year history outside the pandemic period.

For small and midsize businesses, that combination creates operating risk. Strong demand paired with slower supplier deliveries and a tight labor pool can delay fulfillment, strain customer relationships, and push up overtime costs. Rising backlogs point to revenue ahead but also to delivery commitments that may be harder to meet.

Input Costs Are Rising Faster Than Selling Prices

The price data are the most important part of the September report for inflation. Average input costs across goods and services rose at the fastest rate since October 2022. Respondents mainly cited higher fuel and transport costs, and many also reported rising wage pressure.

Service sector input cost inflation reached its highest level since November 2022. In manufacturing, high raw material prices were often linked to supply shortages, although factory input inflation remained below peaks seen earlier this year during the energy price spike.

Selling prices rose more slowly. Output price inflation picked up from August but stayed below the rates recorded from March through July, and competition held back price increases in services. When costs rise faster than selling prices, margins shrink.

Williamson said growing backlogs indicate companies are gaining pricing power, which he described as a concern for the inflation outlook. That suggests the gap between costs and prices may narrow in the coming months as businesses pass through more of their cost increases.

Markets Read the PMI as Pressure on the Fed

Financial markets reacted quickly. Treasury yields rose after the PMI release, and the 10-year Treasury yield reached 5.135%, its highest level since July 2007. Major stock indexes closed lower on September 23.

The report comes a week after the Federal Open Market Committee voted 12–0 on September 16 to raise the federal funds target range by a quarter point to 3.75%–4.00%, its first increase since 2023. The FOMC statement said inflation remains elevated. The committee’s projections showed 16 of 18 participants expecting another increase this year. The next FOMC decision is scheduled for October 28.

For businesses with variable-rate credit lines or loans tied to the prime rate, the September PMI supports the case for higher borrowing costs. Strong growth and accelerating input costs give the Fed little reason to pause.

Service Sector Confidence Lags Behind Activity

Despite the strong activity readings, expectations for the year ahead were unchanged in September. Manufacturers were more optimistic than service providers, and factory confidence is near its long-run average.

Service sector sentiment remained well below trend. Respondents cited cost-of-living pressures, higher borrowing costs, and political uncertainty. The gap between strong current activity and weak service sector confidence suggests many operators see the current growth as fragile.

The Flash Reading Comes With Caveats

The flash PMI is based on about 80% to 90% of total survey responses, collected September 10–22, 2026, from panels of about 650 manufacturers and 500 service providers. Historically, the average absolute difference between flash and final readings has been 0.4 points for the composite and services indexes and 0.3 points for manufacturing.

PMI surveys measure the breadth of change, not its size. A reading of 58.4 means more businesses reported growth than decline. It does not directly measure output. Official data on gross domestic product, inflation, and employment will show whether September’s survey results hold up.


Disclaimer: This article is for informational purposes only and does not constitute financial, investment, business, economic, or tax advice. The PMI data discussed are survey-based indicators and do not directly measure overall economic output or guarantee future economic conditions. Readers should consider additional official economic data and consult a qualified financial or tax professional before making decisions based on economic or financial information.


FAQs

What was the September 2026 flash PMI reading?

The S&P Global Flash US Composite PMI Output Index rose to 58.4 in September 2026 from 56.0 in August. It was the fastest private-sector expansion since July 2021.

What does a PMI above 50 mean?

A reading above 50 means more surveyed businesses reported improvement than decline compared with the previous month. A reading below 50 indicates contraction.

Why are business input costs rising?

Survey respondents mainly cited higher fuel and transport costs, along with rising wages. Input cost inflation across goods and services reached its highest level since October 2022.

How does the PMI affect Federal Reserve policy?

Strong growth combined with rising input costs signals inflation pressure, which supports further rate increases. The Fed raised rates on September 16, and its next decision is scheduled for October 28.

When will final September PMI data be released?

Final manufacturing PMI data will be published October 1, 2026. Final services and composite data follow on October 5.


How Professional Ghostwriting Services Help Turn Ideas Into Books

Many people have a book idea but never get the opportunity to turn that idea into a complete manuscript. Work commitments, limited writing experience, or simply not knowing where to begin can make the process difficult. Professional ghostwriting services can help authors move from an early concept to a structured and readable book.

Ghostwriting is used for many types of projects, including memoirs, biographies, novels, business books, self help books, and other forms of nonfiction. The process allows authors to share their ideas and vision while a professional writer helps develop those ideas into a complete manuscript.

What Is Ghostwriting?

Ghostwriting is a professional writing arrangement in which a writer creates content based on another person’s ideas, experiences, knowledge, or instructions. The author provides the direction and subject matter, while the ghostwriter handles much of the writing work.

The level of involvement can vary from project to project. Some authors have detailed outlines and need help developing the chapters, while others have only a basic concept and require assistance with planning and writing the entire manuscript.

Professional ghostwriting services can help organize this process and provide writing support based on the author’s specific project.

Turning an Idea Into a Structured Book

A book idea can start as a few notes, personal experiences, conversations, or a simple concept. Turning those ideas into a complete book requires structure.

A professional ghostwriter can help develop the central concept, organize chapters, establish the flow of information, and determine how different ideas should be presented. For fiction, the process may involve character development, plot structure, dialogue, and pacing. For nonfiction, it may focus on research, organization, explanations, and the author’s expertise.

A clear structure gives the manuscript direction and makes it easier for readers to follow the content.

Preserving the Author’s Voice

One of the most important aspects of ghostwriting is maintaining the author’s perspective. A book should reflect the author’s ideas, experiences, and intended message rather than simply sounding like the writer.

Before writing begins, authors and ghostwriters may discuss the project’s purpose, target audience, tone, writing style, and key ideas. Interviews, notes, recordings, outlines, and other source material can also help the writer understand the author’s voice.

Regular communication throughout the project can help keep the manuscript aligned with the author’s original vision.

Ghostwriting Can Save Authors Time

Writing a complete book requires a significant investment of time. Authors who have demanding professional or personal responsibilities may find it difficult to dedicate enough hours to writing every chapter.

Working with a professional writer can allow authors to focus on their expertise and ideas while receiving support with the actual manuscript development.

This can be especially useful for professionals, entrepreneurs, public speakers, and individuals who have valuable experiences to share but limited time to write.

Different Types of Books Can Benefit From Ghostwriting

Ghostwriting is not limited to one particular genre. Professional writers may work on a wide range of projects depending on their experience and the author’s requirements.

Memoirs and autobiographies can benefit from interviews and structured storytelling, while fiction projects may require extensive work on characters and plot development. Business and self help books may focus on presenting the author’s knowledge in a clear and accessible format.

Authors can also explore specialized book writing services when they need broader assistance developing their manuscript.

Editing Comes After the Writing

Completing a manuscript is an important milestone, but the writing process does not necessarily end with the first draft. Editing can help improve the structure, clarity, grammar, consistency, and overall readability of the book.

Professional book editing services can provide another level of review before the manuscript moves toward publication. An editor can identify areas that may need clarification or improvement while helping preserve the author’s intended message.

Moving From Manuscript to Publication

After the manuscript has been written and edited, authors can begin preparing the book for publication. This may involve formatting, cover design, publishing, distribution, and marketing.

Professional book publishing services can help authors navigate the publishing stage and prepare their work for readers.

Having a clear plan for each stage can make the overall process easier to manage and reduce confusion for first time authors.

Final Thoughts

A great book can begin with nothing more than an idea, a personal experience, or knowledge that an author wants to share. The challenge is turning that starting point into a complete manuscript that readers can understand and enjoy.

Professional ghostwriting services can provide the writing expertise and structure needed to develop an idea into a finished book while keeping the author’s vision at the center of the project. With additional support from editing and publishing services, authors can move through the process from initial concept to publication in a more organized way.

Built to Perform and How Abdul Foster Has Spent His Career Studying What Makes Growth Work

From performance training to sports technology and business development, the Berry Dynamic Agency executive has repeatedly returned to the same question: What has to change when good work is ready to become something bigger?

Abdul Foster has spent much of his professional life around performance, first in a literal sense and later in business. His career has crossed fitness, entrepreneurship, technology and business development, but beneath those shifts is a consistent interest in systems: how people work, how customers move through an experience and what must happen behind the scenes for something successful to continue growing.

That perspective now defines much of Foster’s role as Executive Director of Berry Dynamic Agency, where he leads work connected to business development, strategy, client experience and growth. His addition to the agency’s leadership team helped expand Berry Dynamic beyond its communications foundation and into a broader examination of what prevents otherwise capable businesses from moving forward.

Foster did not arrive at that work through a traditional consulting path. His entrepreneurial background developed through the fitness and performance world, where results are difficult to separate from execution. Training programs must work in practice, not simply on paper. Customers need a clear way to schedule, pay, and communicate. Professionals need systems that allow them to spend less time managing administrative work and more time delivering the service people hired them to provide.

Those experiences eventually contributed to Foster founding Trainr., a Houston-based sports technology company built around tools for coaches and trainers. The platform has addressed functions including scheduling, billing, booking, payments, messaging, and workout creation, essentially bringing together tasks that independent fitness professionals often manage through multiple disconnected tools.

Trainr. also placed Foster more directly inside Houston’s technology and startup community. The company participated in DivInc’s 2024 Sports Tech Accelerator cohort, where founders worked within a broader environment focused on sports innovation and scalable technology businesses. The experience reflects Foster’s movement from delivering services himself to thinking about how technology can help an entire category of professionals operate differently.

That transition is important to understanding his work at Berry Dynamic. Foster knows what it feels like to move from practitioner to business owner and from business owner to builder of a system other people are expected to use. Each stage requires a different way of thinking.

Many entrepreneurs eventually encounter the same tension. The habits that helped them reach their first level of success are not always the habits that will support the next one. A founder can personally answer every client call when there are ten customers. That becomes harder at 100. A service can depend heavily on the founder’s personal skill when it is small, but growth eventually requires documented processes, clearer offers, better customer pathways and decisions about what should be automated, delegated or redesigned.

Foster’s work at Berry Dynamic is concerned with that transition.

The agency’s Business Scalability pathway focuses on barriers such as business development, customer pathways, market positioning, websites, product launches and systems needed to support growth. Berry Dynamic’s Business Scalability Index takes the idea further by examining the leadership, operations, and growth barriers that may be keeping an organization from expanding effectively.

Foster’s approach is particularly useful for businesses that have already proven they can attract customers but cannot understand why growth continues to feel harder than it should. Sometimes the problem is not demand. It is the amount of friction hidden inside the business.

A customer may have difficulty understanding what to purchase. The website may send visitors in too many directions. The founder may be personally responsible for tasks someone else could own. Services may have been added over time without anyone stopping to examine whether they still fit together. Sales may increase while profit does not. More opportunities may actually create more chaos.

Those are growth problems, but they are not solved simply by telling a company to work harder.

Foster’s background in performance makes that distinction particularly fitting. In athletics, improvement rarely comes from repeating the same movement with greater intensity forever. Performance requires evaluating what is working, correcting what is not and building systems that make better execution repeatable. His business philosophy follows a similar pattern.

Within Berry Dynamic’s executive team, Foster occupies the space between preparation and recognition. COO Dr. Xanthea Moore focuses heavily on financial readiness, structure and operational discipline. Founder Ciara Suesberry-Roberts leads communications, public relations and authority positioning. Foster’s work asks whether the business itself can move effectively between those two points. Once an organization is prepared and demand begins to increase, can its systems actually support the growth?

The three areas overlap deliberately. A publicity campaign can expose a weak customer journey. A major funding opportunity can strain inadequate operations. A new website cannot compensate for an offer that no longer makes sense. Foster’s role is not simply to help businesses become larger but to examine what must become clearer or stronger before growth creates a new set of problems.

That is one reason Berry Dynamic’s current direction fits his experience. The agency’s refreshed model begins with identifying the gap rather than prescribing the same solution to every company. For some businesses, the answer will be communications. For others, capital readiness. For another, the most valuable work may happen quietly inside its processes long before anyone sees a new advertisement or press feature.

Foster’s career has moved from improving individual performance to building tools for other professionals and now helping businesses examine their own capacity for growth. The industries have changed, but the central question has remained remarkably consistent.

What does better performance actually require?

For Foster, the answer is rarely more noise. It is usually a better system.

Rising Borrowing Costs Create a Two-Speed Economy as Mortgage Rates Top 7% and Consumer Credit Card Debt Reaches $1.26 Trillion

The Federal Reserve’s September 16 rate hike to 3.75%–4% has widened a growing split in the U.S. economy, where consumer spending on retail and dining remains resilient while rate-sensitive sectors including housing, auto lending, and small business financing are deteriorating under borrowing costs not seen in more than two decades.

Key Takeaways

  • The 30-year fixed-rate mortgage reached 7.19% following the Fed’s September 16 rate hike, up 38 basis points since Fed Chair Kevin Warsh’s August 28 Jackson Hole speech and more than a full percentage point from a year earlier.
  • The 10-year Treasury yield crossed 5% on September 14 for the first time since 2023, directly pushing up mortgage rates, auto loan pricing, and small business borrowing costs.
  • U.S. credit card balances reached $1.26 trillion in Q2 2026, a new record for the eleventh consecutive quarter, with the average APR for cards accruing interest rising to 22.15%.
  • The NAHB Housing Market Index fell to 32 in September, while August retail sales rose 1.2% month-over-month, beating consensus by 30 basis points, illustrating the divergence between rate-sensitive and consumer-facing sectors.
  • There is typically a six-month lag between a housing slowdown and decreased spending on consumer durables, meaning the full impact of current mortgage rates may not reach furniture, appliance, and flooring retailers until early 2027.

The Fed’s First Rate Hike Since 2023 Pushed Short-Term Borrowing Costs Higher Across the Board

The FOMC voted 12-0 on September 16 to raise the federal funds rate by 25 basis points to a target range of 3.75%–4%, the first increase since the committee was still cutting rates in late 2023. Fed Chair Kevin Warsh, who took over from Jerome Powell earlier in 2026, described inflation as “elevated” in his post-meeting press conference and noted that economic activity continues to expand at a solid pace. The September dot plot projects a year-end rate between 4.1% and 4.4%, and futures markets are pricing in another quarter-point hike by December with rates potentially reaching 4.7% by September 2027.

The rate hike arrived in an environment where longer-term Treasury yields had already been climbing for weeks. The 10-year Treasury yield crossed 5% on September 14, reaching levels not seen since 2023. The 20-year yield hit 5.39%. The 2-year yield, which is the most sensitive to rate expectations, closed at 4.745% on September 16, up approximately 10 basis points on the day. Those moves did not occur in isolation. They reflected a convergence of factors: persistent inflation readings, geopolitical risk from the Middle East conflict driving energy costs higher, and the relentless demand for capital to fund artificial intelligence infrastructure buildouts, all competing for bond market financing simultaneously.

Mortgage Rates at 7.19% Have Pushed Homebuilder Confidence to Multi-Year Lows

The 30-year fixed-rate mortgage rose to 7.19% in the wake of the rate decision, a figure that carries weight across the economy far beyond the housing sector itself. The rate is up approximately 38 basis points since Warsh’s hawkish Jackson Hole speech on August 28, and more than a full percentage point above where it stood a year ago. The NAHB/Wells Fargo Housing Market Index dropped three points to 32 in September. NAHB Chairman Bill Owens cited weakened buyer traffic driven directly by rising mortgage rates, alongside higher material costs, rising gas and diesel prices, and persistent labor shortages as compounding factors.

Mortgage originations had already slowed to $530 billion in Q1 2026, per the New York Fed’s Household Debt and Credit Report, and Mortgage Bankers Association data shows applications continuing to decline. The housing slowdown carries a delayed economic effect that extends well beyond the transaction itself. Research consistently shows a roughly six-month lag between declining home sales and reduced spending on big-ticket household goods, including furniture, appliances, carpeting, and home renovation materials. That means the current mortgage rate environment, which has been elevated since late August, may not fully register in consumer durables data until the first quarter of 2027.

Consumer Credit Card Debt Hit $1.26 Trillion While APRs Climbed Past 22%

While the housing market contracts under the weight of higher rates, consumer credit tells a different story about how Americans are financing their daily lives. Total U.S. credit card balances reached $1.26 trillion in Q2 2026, per the New York Fed, marking a new record for the eleventh consecutive quarter and representing a 4.5% increase from a year earlier. The figure has nearly doubled from the $770 billion trough recorded in Q1 2021. Total consumer credit outstanding, which includes credit cards, auto loans, student loans, and other non-mortgage debt, reached $5.17 trillion as of June 2026, a figure that has more than tripled since 2000.

The cost of carrying that debt has increased sharply. The Federal Reserve’s G.19 consumer credit report showed the average APR for credit cards accruing interest rose to 22.15% in Q2 2026, up from 21.52% in Q1. For new credit card offers, the average APR stands at 23.82%. The stock of credit card balances that are more than 90 days delinquent rose from 7.6% in Q3 2022 to 12.8% by Q1 2026, according to the New York Fed’s analysis, though the institution noted that the rising stock rate is partly a compositional effect driven by a slower resolution of previously delinquent accounts rather than a surge in new defaults. The 30-day delinquency rate actually dipped to 2.85% in Q2 2026, the eighth straight quarterly decrease. The aggregate delinquency rate across all consumer debt stood at 4.7% in Q2 2026.

Retail Spending Remains Strong, Masking Weakness in Rate-Sensitive Sectors

The paradox at the center of the two-speed economy is that consumers are still spending at a pace that surprised economists as recently as mid-September. Advance retail sales for August 2026 came in at $773.9 billion, up 1.2% month-over-month and 6.0% year-over-year, well above the 0.9% consensus estimate. Control-group retail sales, the component that feeds directly into GDP calculations, jumped 1.4% after a 0.4% decline in July. Gains were broad-based across gasoline, online retail, and restaurants. The Atlanta Fed subsequently raised its third-quarter GDP growth estimate on the strength of the report.

That resilience has been partially financed by the tax reform effects of the 2025 Big Beautiful Bill. Americans saw approximately an 11% increase in average tax refunds during the first half of 2026, and the Brookings Institution’s Fiscal Impact Measure estimates that the income boost from lower taxes contributed 0.4 percentage points to GDP in the first half of the year. That tailwind, however, is fading as the refund cycle completes, removing a meaningful cushion from both consumer spending and small business cash flow heading into Q4.

Small Businesses Face Financing Costs That Have Not Been This High in Years

For small business owners and founders, the rate environment translates into tangibly higher costs on every form of borrowing that depends on longer-term Treasury yields: SBA loans, commercial real estate financing, equipment leases, and lines of credit. The NFIB Small Business Optimism Index dipped to 98.7 in August 2026 while the Uncertainty Index remained at 89, a full 21 points above its historical average of 68. NFIB Chief Economist Bill Dunkelberg cited weakened sales, supply chain disruptions, and inflation pressures as the primary concerns, with over 20% of small businesses continuing to report that finding qualified labor remains their single biggest problem.

The structural challenge for small businesses is that the Fed’s rate hike mechanism does not distinguish between the parts of the economy that are running warm and the parts that are already cooling. Rate increases apply uniformly, making borrowing more expensive across the board. The sectors that are driving economic strength, particularly AI-related capital expenditure and energy infrastructure, are largely financed by large corporations with access to capital markets. Small businesses relying on bank lending and SBA-backed products absorb the same rate increases without the same ability to pass costs through to customers. That asymmetry is what defines the two-speed economy: the same monetary policy that aims to cool inflation in aggregate is tightening conditions unevenly, squeezing the businesses and households that are most dependent on borrowed capital while barely slowing the sectors that have the cash reserves to absorb higher rates without changing behavior.

Auto loan balances rose to $1.69 trillion in Q1 2026, per the New York Fed, and TransUnion projects 60-plus-day auto loan delinquencies reaching 1.54% by year-end, marking the fifth straight year of increases in that category. The New York Fed’s Joelle Scally noted that “new delinquencies for auto loans and credit cards remain at elevated levels.” For entrepreneurs and small business owners who also carry personal auto loans and credit card balances, the compounding effect of higher rates across every form of debt simultaneously creates a personal financial environment that constrains risk-taking, hiring, and capital investment at precisely the moment the macroeconomic headlines suggest the economy is holding up well.

FAQs

What Is The Current 30-Year Mortgage Rate?

The 30-year fixed-rate mortgage reached 7.19% following the Federal Reserve’s September 16, 2026, rate hike. The rate is up approximately 38 basis points since Fed Chair Kevin Warsh’s August 28 Jackson Hole speech and more than a full percentage point from a year earlier.

How Much Credit Card Debt Do Americans Carry?

U.S. credit card balances reached $1.26 trillion in Q2 2026, per the New York Fed, a new record for the eleventh consecutive quarter. The average APR for cards accruing interest stands at 22.15%, while new card offers average 23.82%.

Why Did The Federal Reserve Raise Interest Rates In September 2026?

The FOMC voted 12-0 to raise the federal funds rate by 25 basis points to 3.75%–4% on September 16, citing elevated inflation and solid economic activity. Fed Chair Kevin Warsh indicated that inflation remains above the committee’s target and that economic indicators across productivity, investment, and domestic spending remain strong.

How Are Rising Rates Affecting Small Businesses?

Higher longer-term Treasury yields translate directly into higher financing costs on SBA loans, commercial real estate, equipment leases, and lines of credit. The NFIB Small Business Optimism Index dipped to 98.7 in August 2026, with the Uncertainty Index at 89, well above its historical average of 68.

When Will The Housing Slowdown Affect Consumer Spending On Furniture And Appliances?

Research shows a roughly six-month lag between declining home sales and reduced spending on big-ticket household goods. The current mortgage rate environment, elevated since late August 2026, may not fully impact consumer durables spending until early 2027.

The L-1A Visa Is the Bridge in Most Company Expansion Plans

A growing company decides the US market can no longer be served from abroad. The board approves an American entity, and two questions land on the same desk: who runs it, and on what status does that person enter the country? The second question’s most established answer is the L-1A.

The corporate relationship works in both directions

L-1A transfers executives and managers from a foreign company to its related US company, and the qualifying relationship is the file’s foundation. The direction is flexible: the foreign company may be the parent, or the US company may be. What must be documented is the link between the two entities.

The role standard is demanding but not narrow: meeting either the executive or the managerial definition suffices. And a detail that matters to family businesses everywhere: the transferred manager may be the company’s owner, or a non-owner with genuine management authority.

New office cases are their own discipline

A freshly formed US entity does not close the route; it changes the file type. The strategy decisions come in a chain: L-1A or L-1B, standard or New Office filing, change of status or consular processing, which corporate documents, and whether to coordinate with a future EB-1C green card case from the start.

The evidence bar shows in the Requests for Evidence this category generates: insufficient proof of the corporate relationship, vague role descriptions, doubts about whether a small US company can support a genuinely managerial role, and, in new office cases, thin evidence of premises, capital, or a viable business plan. The response clock is regulatory: up to 84 days.

Process and price, without surprises

A filed petition ends one of three ways: approval, a Request for Evidence, or denial. The applicant’s location picks the track. Someone already in the US in another status can switch to L-1 without leaving, documented by the approval notice; someone abroad completes the online application after petition approval and interviews at the US consulate in their home country.

The fee stack varies with company profile: an asylum program fee of $600, $300, or zero; the $500 fraud prevention fee; $2,965 for premium processing where used; and dependant applications at $470 on paper or $420 online. On the family side, children in L-2 status attend public or private school.

Renewals re-test the business, not just the person: ongoing corporate relationship, a current role and organization chart, financial statements showing an operating company, and proof the original conditions still hold. A first year of disciplined record-keeping is, in practice, the second year’s renewal file. A denial leaves options: refiling with stronger evidence, motions to reopen or reconsider, or an alternative category.

The real prize sits one filing later

Transfer speed is the visible benefit. The strategic one is the door L-1A opens: green card routes for L-1 holders include employer-sponsored labor certification and, for qualifying profiles, the extraordinary-ability category. For executives specifically, the EB-1C multinational manager category mirrors the L-1A fact pattern almost exactly: a year of managerial service abroad within the preceding three, continuing in a managerial role at the related US company.

A well-built L-1A file is usually the first of two filings, which is why an L-1A visa lawyer plans the transfer and the permanence question together. Grape Law’s L-1A guide covers the corporate relationship tests, new office requirements, and the process stage by stage; Grape Law’s expansion clients hear the strategy question in the first meeting: where does this transfer sit in the permanent structure?

Companies that answer that early buy their executive one process instead of two.

Fees cited were verified against the USCIS fee schedule as of August 19, 2026. This article is for general information only and is not legal advice. Every immigration case turns on its own facts. Consult an immigration attorney about your specific situation.

Disclaimer: This article is for general informational purposes only and does not constitute legal advice. Immigration requirements, fees, processing times, and visa availability may change. Every case depends on its specific facts and circumstances. Consult a qualified immigration attorney regarding your situation.

Children’s Book Writing Services for Non-Fiction: How City Light Publishers Helps Authors Educate Young Readers Through Engaging Stories

Writing a children’s nonfiction book requires more than collecting facts and presenting information. The real challenge is transforming complex subjects into engaging experiences that encourage curiosity while maintaining accuracy.

Unlike many adult nonfiction books, children’s nonfiction must satisfy two different expectations. It must provide reliable information while also capturing the attention of young readers who may not have intentionally chosen to learn about the topic. A successful children’s nonfiction book does not feel like a textbook. Instead, it invites exploration, discovery, and imagination.

Children’s book writing services help authors transform educational ideas into structured, age-appropriate books that connect with young audiences. City Light Publishers provides children’s book writing and children’s book editing services, recognizing that nonfiction for young readers requires specialized attention to accuracy, structure, storytelling, and presentation.

Understanding the Different Types of Children’s Nonfiction Books

Children’s nonfiction can take many different forms, and each format requires a unique writing approach.

Concept books introduce young children to basic ideas such as colors, numbers, shapes, and opposites. Although these books may appear simple, creating them requires careful planning because repetition, rhythm, and sequencing must work together to support early learning.

Narrative nonfiction presents real information through storytelling. These books may explore an important discovery, an animal’s life cycle, a historical event, or the journey behind an invention. By using storytelling techniques, narrative nonfiction allows children to connect emotionally with factual information.

Expository nonfiction focuses on explaining a subject, such as how the human body works, why volcanoes erupt, or how technology functions. The challenge is creating a structure that informs without becoming a collection of disconnected facts.

Social-emotional nonfiction explores feelings, relationships, and personal experiences. These books can help children understand emotions, friendship, change, and challenges, but they must be handled carefully to avoid becoming overly instructional.

Biography introduces children to real people and their achievements. The challenge is making a person’s life understandable and meaningful for young readers who may not have knowledge of the historical or cultural background surrounding that individual.

Professional children’s book writing services help authors determine which structure best fits their idea and audience.

Starting With a Child’s Question Instead of an Adult’s Subject

The strongest children’s nonfiction books begin with curiosity.

Adults often organize information based on the structure of a subject. They may begin with history, explanations, definitions, and examples. Children approach learning differently. They naturally ask questions such as “Why does this happen?”, “How does it work?”, “What would happen if?”, or “How big is it?”

A successful children’s nonfiction book is often built around the question a child would genuinely ask.

For example, “The ocean” is a broad topic, but “What lives in the deepest part of the ocean?” creates a focused idea that immediately sparks curiosity.

Choosing a specific angle helps create a stronger reading experience because children are drawn toward discovery rather than simply receiving information.

Balancing Accuracy With a Child’s Reading Level

One of the most difficult parts of writing nonfiction for children is simplifying information without making it inaccurate.

Young readers need explanations that are easy to understand, but those explanations must also remain truthful. Removing unnecessary complexity is important, but changing facts into misleading statements can create confusion later.

Professional children’s book writers must carefully decide which details are essential and which can be introduced at a later stage. The goal is not to reduce knowledge but to present it in a way that matches the child’s understanding.

Accuracy also requires careful handling of uncertainty. When science or history includes information that continues to develop, writers must avoid presenting guesses as absolute facts. The information children remember should always be the correct information.

City Light Publishers highlights the value of subject expertise during the editing process, as editors familiar with specific fields can help identify whether a simplification improves understanding or creates distortion.

Creating Emotional Books Without Turning Them Into Lessons

Social-emotional children’s books are among the most requested categories, but they are also among the easiest to make ineffective.

A common mistake is creating a story where a child faces a problem, an adult explains the lesson, and the final page directly states the message. While the intention may be positive, children often recognize when a story is teaching them instead of allowing them to experience the story naturally.

The strongest emotional books show rather than explain.

A story about a child feeling nervous on the first day of school becomes meaningful when it shows the real experience; the uncomfortable feelings, the small mistakes, the uncertainty, and the moment of growth.

A useful test is removing the final explanation. If the story still communicates its meaning, the message was naturally built into the experience. If the story loses its impact, the explanation may have replaced the storytelling.

Effective children’s book writing services focus on creating authentic experiences rather than simply delivering lessons.

Why Back Matter Adds Value to Children’s Nonfiction Books

Children’s nonfiction has an advantage that many fiction books do not: additional educational content at the end of the book.

Glossaries, timelines, source notes, activity sections, and further reading recommendations can make a children’s nonfiction book more valuable for families, teachers, and libraries.

These additional sections help expand the usefulness of a book because the same title can support different age groups. Younger children may enjoy the main story through reading aloud, while older children can explore the additional information independently.

For adult buyers, including research notes and supporting information also demonstrates credibility and helps establish trust in the quality of the book.

Understanding the Children’s Nonfiction Market

Children’s nonfiction publishing works differently from many other categories because purchases are often influenced by parents, educators, libraries, and gift buyers.

This makes professional presentation especially important. Physical books remain highly valuable in this category because schools, libraries, and families often prefer printed copies.

Book covers also serve an important purpose because adult buyers frequently make quick decisions based on whether the book appears trustworthy, age-appropriate, and professionally produced.

Series potential can also create long-term value. A successful format that introduces children to multiple subjects can become a collection rather than a single book.

City Light Publishers states that authors retain 100% ownership, rights, and royalties, making ownership an important consideration for authors developing characters, formats, or educational series with future potential.

Professional Production for Children’s Nonfiction Books

Children’s nonfiction books require careful production because they often depend heavily on illustrations, layouts, and visual organization.

Professional formatting must consider image quality, margins, print requirements, and the differences between digital formats. Fixed-layout digital editions and printed books with illustrations require specific production standards to maintain quality.

City Light Publishers supports authors through editing, formatting, cover design, printing, and distribution across platforms including Amazon KDP, Barnes & Noble, Kobo, Apple Books, Google Books, IngramSpark, and Draft2Digital.

However, production quality alone cannot replace strong writing. A beautifully designed book still needs a meaningful question, accurate information, and engaging storytelling to keep young readers interested.

Helping Authors Create Meaningful Educational Stories

A successful children’s nonfiction book does not simply provide information. It creates curiosity, encourages exploration, and helps young readers understand the world around them.

City Light Publishers provides children’s book writing services designed to help authors transform educational ideas into engaging nonfiction books for young readers.

Through professional writing, editing, formatting, design, and publishing support, authors can create children’s books that educate without lecturing and inspire children to continue learning beyond the final page.

Why Sue Phillips Continues to Define Luxury in Fragrance

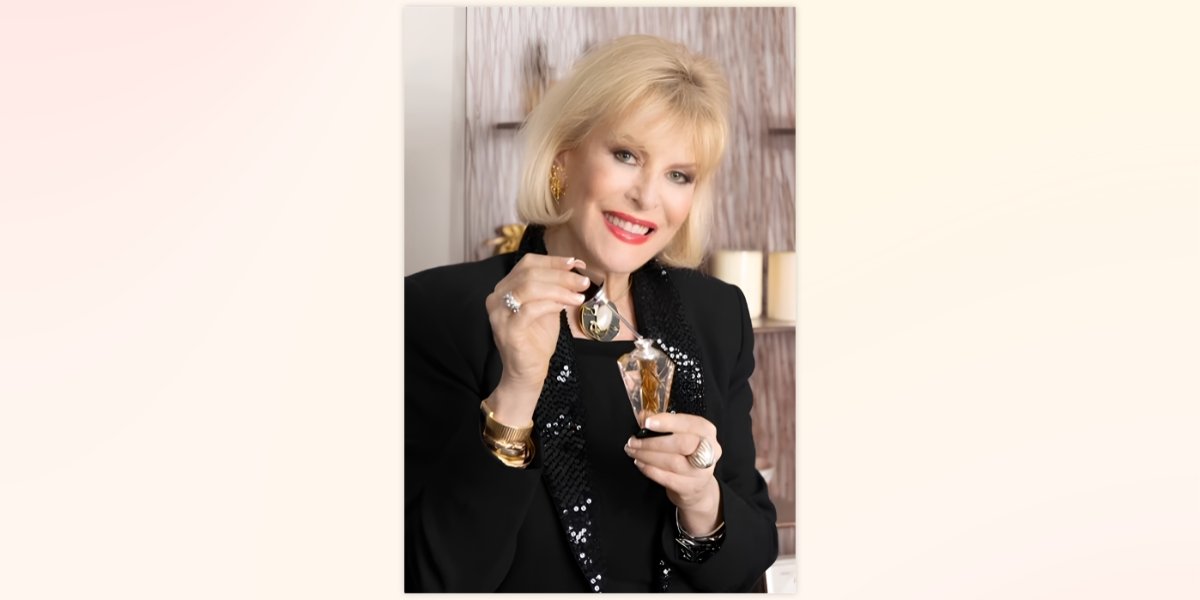
Luxury has always been defined by what cannot be replicated. It is found in exceptional craftsmanship, timeless design, personalized experiences, and the emotional connections people create with the world’s finest brands. Few individuals understand this philosophy more intimately than Sue Phillips, an internationally recognized fragrance expert, author, entrepreneur, and founder of Scenterprises.

For more than four decades, Phillips has quietly shaped the fragrance industry from behind the scenes while building a remarkable legacy of innovation. From creating iconic fragrance launches for global luxury brands to developing personalized scent experiences for clients from around the world, she has transformed perfume from a simple beauty product into one of the most intimate forms of personal expression.

Today, as founder of the Scenterprises Fragrance Studio in New York City, Phillips continues to redefine what luxury means by proving that the most memorable accessory a person can wear is one that cannot be seen. It can only be experienced.

A Career Built on Innovation

Before becoming a widely respected voice in the fragrance world, Sue Phillips developed an extraordinary foundation inside some of the industry’s most prestigious companies.

Her career includes executive leadership positions with globally recognized luxury houses, including Tiffany & Co., where she served as Vice President of Marketing for Fragrance. During her tenure, Phillips played a key role in helping establish fragrance as an essential extension of luxury branding.

She later contributed to successful fragrance launches and brand development for renowned names including Burberry, Trish McEvoy, Avon, Diane von Furstenberg, Lancaster, and many other internationally recognized beauty and fashion companies.

While countless consumers recognize these iconic fragrances, few realize the strategic vision and creative expertise required to transform a brand’s identity into an unforgettable scent.

For Phillips, fragrance has never been simply about perfume.

It is storytelling.

It is psychology.

It is branding.

It is memory.

Most importantly, it is emotion.

The Invisible Luxury

Unlike fashion, jewelry, or handbags, fragrance exists in a completely different category of luxury.

It cannot be photographed.

It cannot be displayed on social media.

Its greatest impact happens in memory.

That understanding has guided Phillips throughout her career.

She believes fragrance communicates personality before words are ever spoken. Scientific studies have repeatedly demonstrated that scent is closely connected to emotion and long-term memory, making fragrance one of the most powerful sensory experiences humans possess.

This philosophy became the inspiration behind her signature approach to fragrance customization.

Rather than asking clients what perfume they currently wear, Phillips begins with a very different question:

“How do you want people to remember you?”

That simple conversation often becomes the beginning of an entirely personalized fragrance journey.

Creating the World’s Most Personal Luxury

Walk into the Scenterprises Fragrance Studio in New York and you’ll quickly realize this isn’t a traditional perfume boutique.

Instead of browsing shelves filled with designer fragrances, guests participate in an immersive consultation designed to uncover personality, lifestyle, preferences, memories, and emotional connections.

Every consultation is highly individualized.

Every fragrance becomes completely unique.

No two creations are identical.

Clients participate in selecting notes ranging from delicate florals and bright citrus to sophisticated woods, warm ambers, exotic spices, and rich musks. Throughout the creative process, Phillips guides each guest through the art and science of fragrance composition until the final scent reflects their personal identity.

The result is something increasingly rare in today’s luxury marketplace:

A product created exclusively for one individual.

No mass production.

No trend following.

Simply authentic personalization.

Luxury Is Becoming Personal Again

As luxury consumers increasingly seek experiences rather than possessions, Phillips’ philosophy has become more relevant than ever.

Today’s discerning clientele wants authenticity.

They value craftsmanship.

They seek meaningful experiences over status symbols.

Personalized fragrance represents all three.

Rather than purchasing another recognizable perfume worn by millions of people worldwide, clients leave with something that belongs only to them.

This shift reflects a broader evolution occurring throughout the luxury marketplace.

Customization is replacing standardization.

Experiences are becoming more valuable than products.

Storytelling has become the new currency of premium brands.

Sue Phillips recognized this movement years before personalization became an industry trend.

The Science Behind Emotion

Phillips often describes fragrance as “the invisible accessory,” but its influence extends well beyond fashion.

Research has shown that scent is processed through areas of the brain associated with memory and emotion, making fragrance uniquely capable of triggering vivid recollections and emotional responses.

A familiar aroma can instantly transport someone back to childhood.

It can recall a wedding day.

A favorite vacation.

A loved one.

A milestone achievement.

This remarkable relationship between scent and memory inspired Phillips to write her book, The Power of Perfume.

The book explores how fragrance influences confidence, relationships, emotional well-being, branding, and personal identity while making the science of scent accessible to everyday readers.

It has become an essential guide for anyone interested in understanding why fragrance affects human behavior so profoundly.

Building Confidence Through Fragrance

Throughout her career, Phillips has witnessed thousands of transformations that have little to do with appearance.

Instead, they begin with confidence.

She believes the right fragrance can become part of an individual’s personal presence, helping reinforce how they wish to be perceived professionally and socially.

Executives often seek fragrances that project authority and sophistication.

Entrepreneurs look for scents that communicate creativity and originality.

Brides desire fragrances that preserve one of life’s most meaningful memories.

Families commission custom scents to celebrate anniversaries, birthdays, and multi-generational milestones.

Each project reflects Phillips’ belief that fragrance becomes part of a person’s story.

A Global Authority

Phillips’ expertise has made her a sought-after voice in fragrance media.

She has appeared on major television programs, radio broadcasts, podcasts, and digital platforms discussing fragrance trends, luxury branding, wellness, gift-giving, and seasonal scent recommendations.

Her approachable style makes complex fragrance concepts understandable while inspiring audiences to think differently about scent.

Whether speaking with beauty editors, luxury publications, corporate audiences, or consumers, Phillips consistently emphasizes that fragrance should never overwhelm. It should enhance the individual wearing it.

That philosophy has earned her clients across industries ranging from entertainment and fashion to hospitality, corporate leadership, and private luxury clientele.

Entrepreneurship with Purpose

While many recognize Phillips for her fragrance expertise, her entrepreneurial journey is equally inspiring.

Building Scenterprises required vision, resilience, creativity, and an unwavering commitment to excellence.

Rather than competing solely within traditional retail channels, Phillips created an entirely new category of experiential luxury centered around education, personalization, and memorable client experiences.

Her business demonstrates how innovation often comes from challenging industry norms rather than following them.

In an increasingly digital world, she has built a thriving business around authentic human connection.

Every consultation begins with conversation.

Every fragrance begins with listening.

Every experience becomes a collaboration.

That commitment to service continues to distinguish Scenterprises from conventional fragrance brands.

The Future Smells Personal

As technology continues to reshape luxury retail, Sue Phillips believes the future belongs to brands that create genuine emotional connections.

Artificial intelligence may recommend products.

Algorithms may predict preferences.

But true luxury still requires human creativity, empathy, craftsmanship, and personalization.

These principles remain at the heart of everything Phillips creates.

Her work reminds us that fragrance is far more than a finishing touch.

It is identity.

It is memory.

It is emotion.

It is confidence.

It is art.

Most importantly, it is one of the few luxuries capable of becoming completely personal.

In an era where authenticity has become the ultimate luxury, Sue Phillips continues to demonstrate why scent remains one of the most powerful forms of self-expression.

Long after fashion trends fade and accessories change, the right fragrance becomes part of the story people remember.

And for Sue Phillips, creating unforgettable stories, one fragrance at a time, has always been the true essence of luxury.

Explore More About Sue Phillips

https://suephillips.com/

https://www.instagram.com/suephillipsfragrances/

https://suephillips.com/products/create-your-custom-perfume

https://suephillips.com/pages/book

U.S. Retail Sales Surge 1.2% in August, Nearly Double Economists’ Expectations

U.S. retail and food services sales rose 1.2% in August to $773.9 billion, reversing July’s revised 0.5% decline and nearly doubling the 0.7% gain economists had anticipated, according to the Commerce Department’s Advance Monthly Retail Trade Survey released September 16, 2026. The rebound was broad-based, with strength across online retail, restaurants, furniture, and clothing, and it held up even after stripping out higher gasoline prices. The control group, the subset of retail categories that feeds directly into GDP calculations, rose 1.4%, well above the 0.5% consensus, signaling that the consumer spending engine behind roughly two-thirds of U.S. economic output remains intact heading into the fourth quarter.

Key Takeaways

  • U.S. retail and food services sales rose 1.2% month-over-month in August to $773.9 billion, per the U.S. Census Bureau. Economists surveyed by FactSet had expected a 0.7% gain. July’s decline was revised to 0.5% from the previously reported 0.6%.
  • Year-over-year, total retail sales were up 6.0% compared to August 2025. The three-month June-through-August period was also up 6.0% versus the same stretch a year ago.
  • Excluding gas stations, retail sales rose 1.1%. The control group, which excludes autos, gas, building materials, and food services, rose 1.4%, nearly three times the 0.5% consensus estimate.
  • Online retailers led the category breakdown with a 2.6% gain. Restaurants and bars rose 1.2%, furniture and home furnishings rose 0.9%, clothing and accessories rose 0.7%, and motor vehicles and parts rose 0.6%.
  • The data release landed the same morning the Federal Reserve began deliberations on its September rate decision, adding a consumer-strength data point to the committee’s calculus on whether the economy can absorb tighter monetary policy.

The Rebound Was Broad, Not Just a Gas Price Story

The headline 1.2% figure could be dismissed as a gasoline-price artifact. It should not be. Higher fuel costs did contribute to the topline number, as per-gallon prices for regular unleaded climbed through August amid ongoing supply disruptions tied to the conflict with Iran. But removing gas stations from the calculation only brought the gain down to 1.1%, a margin that still exceeded what most forecasters had penciled in for the full headline.

The control group told a cleaner story. At 1.4%, it outperformed the consensus estimate of 0.5% by a factor of nearly three. The control group matters because it strips out the most volatile retail categories and feeds into the Bureau of Economic Analysis’s calculation of personal consumption expenditures in GDP. A 1.4% control-group print suggests that underlying consumer demand in August was meaningfully stronger than the headline alone captured, and that the third quarter’s GDP calculation will carry a consumption tailwind that was not priced into most economic models at the start of September.

The category-level data reinforced the breadth. Online retailers posted a 2.6% monthly gain, the strongest category performance in the report and a continuation of the secular shift toward e-commerce that has accelerated during periods of high fuel prices, when consumers consolidate shopping trips. Restaurants and bars rose 1.2%, a discretionary spending category that tends to soften early when consumers pull back. Furniture and home furnishings gained 0.9%, and clothing and accessories rose 0.7%. None of those categories are tied to gasoline, and all of them outperformed the prior month.

July’s Dip Was an Anomaly, Not a Trend

The July decline that preceded August’s rebound had raised questions about whether the American consumer was finally hitting a wall. The revised 0.5% drop was the first monthly contraction in retail sales in several months, and it broke a string of positive readings that had been supported by World Cup spending, Amazon Prime Day sales, and the seasonal draw-down of tax refunds that lifted traffic in April and May.

August’s data effectively erased those concerns. The two-month pattern, a dip followed by a stronger-than-expected rebound, is consistent with timing-related noise rather than a structural downshift in consumer behavior. Shoppers who delayed purchases in July appear to have followed through in August, with the added tailwind of back-to-school spending across clothing, electronics, and general merchandise.

The year-over-year comparison provides more durable context. Total retail sales were up 6.0% compared to August 2025, and the rolling three-month June-through-August period was up 6.0% versus the same stretch a year ago. Those figures are not adjusted for inflation, which means real spending growth is lower than the nominal print suggests. But even after accounting for the 3.4% annual CPI rate reported for August, the inflation-adjusted year-over-year gain in retail sales remains positive, a signal that consumer spending volume, not just consumer spending in nominal dollar terms, is still expanding.

What the Data Means for the Fed’s Rate Decision

The retail sales report landed at 8:30 a.m. Eastern on September 16, the same morning the Federal Open Market Committee convened the second day of its September meeting. The timing was not coincidental; the Census Bureau’s release schedule is fixed, and the Fed schedules its meetings around the economic calendar. But the juxtaposition of a hot consumer spending print alongside a rate decision that had already been widely telegraphed as a hike added a specific dimension to the committee’s deliberations.

A Federal Reserve that is raising rates to contain inflation needs evidence that the economy can absorb tighter financial conditions without tipping into contraction. The August retail sales report provided that evidence in clear terms. Consumer spending, which accounts for roughly two-thirds of U.S. economic output, is not just holding up under elevated prices and higher borrowing costs. Consumer spending is accelerating on a monthly basis and maintaining positive real growth on a year-over-year basis. For the Fed, that is both reassurance and complication: reassurance that a rate hike will not push the economy off a cliff, and complication because the same spending strength that supports GDP also sustains the demand-side pressure that keeps inflation above target.

The Fed’s framework for how interest rate decisions are calibrated against incoming economic data depends on exactly this kind of report. A weak retail print would have raised the question of whether the committee was tightening into weakness. A strong print, which is what the committee received, shifts the question to how many more hikes the economy can absorb before spending begins to moderate in a way that would bring inflation closer to target without overshooting into contraction.

Where Consumers Are Spending and Where They Are Not

The category breakdown reveals spending priorities that business owners, retailers, and service providers can map against their own planning cycles. Online retail’s 2.6% gain confirms the channel’s continued share capture, particularly during periods of high fuel prices when the cost of driving to physical stores rises. Restaurants and bars at 1.2% indicate that dining-out spending, one of the first discretionary categories to contract during consumer pullbacks, remains healthy. The furniture and home furnishings gain of 0.9% suggests that housing-related spending, which had been weak for much of 2025 as mortgage rates rose, may be stabilizing even though borrowing costs have not come down.

Motor vehicles and parts rose 0.6%, a moderate gain that reflects a market where high prices and elevated financing costs have stretched purchase cycles but have not stopped transactions. Health and personal care stores posted gains, as did building materials and garden equipment dealers. The categories that declined or posted negligible growth were narrower: electronics and appliances were flat, and sporting goods, hobby, and bookstores saw marginal movement.

For small business owners tracking consumer behavior, the data points to a consumer who is spending broadly but selectively. The strongest gains came in categories where convenience (online retail), experience (restaurants), and necessity (clothing, groceries) converge. Categories that require large upfront outlays or carry higher price sensitivity showed more muted performance, consistent with a consumer who is willing to spend but is still price-aware.

The GDP Implications Are Measurable

The control group’s 1.4% gain carries specific downstream consequences for GDP modeling. The Bureau of Economic Analysis uses the control group as an input for its personal consumption expenditures estimate, which in turn drives the consumer spending component of quarterly GDP. A control-group print this far above consensus pushes the Q3 GDP tracking estimate higher, and several Wall Street forecasting desks updated their models within hours of the release.

The Atlanta Fed’s GDPNow model, which produces a real-time running estimate of quarterly growth, will incorporate the retail data into its next update. Prior to the August retail report, GDPNow and similar nowcasting tools had been projecting moderate Q3 growth in the range of 2.0% to 2.5%. A 1.4% control-group print could push that estimate materially higher, depending on how other September data releases track against expectations.

For entrepreneurs planning Q4 inventory, staffing, and marketing budgets, the retail data provides a concrete planning input. Consumer spending is not contracting. Consumer spending is not merely holding steady. Consumer spending accelerated in August to a degree that surprised the professional forecasting community, and it did so across categories broad enough to suggest the strength is not isolated to a single sector or a single price effect. The question heading into the holiday quarter is whether that momentum sustains through September and October, or whether the combination of higher borrowing costs, elevated fuel prices, and the uncertainty created by the Fed’s tightening cycle introduces friction that slows the pace. The August report, taken on its own, gives more reason for confidence than caution.

FAQs

How Much Did U.S. Retail Sales Rise in August 2026?

U.S. retail and food services sales rose 1.2% in August 2026 to $773.9 billion, according to the U.S. Census Bureau’s Advance Monthly Retail Trade Survey released September 16. The gain nearly doubled the 0.7% increase economists had anticipated and reversed July’s revised 0.5% decline.

Which Retail Categories Grew the Fastest in August 2026?

Online retailers led with a 2.6% monthly gain. Restaurants and bars rose 1.2%, furniture and home furnishings rose 0.9%, clothing and accessories rose 0.7%, and motor vehicles and parts rose 0.6%. Excluding gas stations, overall retail sales still rose 1.1%, indicating the strength was not driven solely by higher fuel prices.

What Is the Retail Sales Control Group and Why Does It Matter?

The control group is a subset of the Census Bureau’s retail sales data that excludes autos, gas stations, building materials, and food services. It matters because the Bureau of Economic Analysis uses it as a direct input for calculating the personal consumption expenditures component of quarterly GDP. In August 2026, the control group rose 1.4%, nearly three times the 0.5% consensus estimate.

How Do August 2026 Retail Sales Compare to the Same Period Last Year?

Total retail sales in August 2026 were up 6.0% compared to August 2025. The rolling three-month June-through-August period was also up 6.0% versus the same stretch a year earlier. These figures are not adjusted for inflation; after accounting for the 3.4% annual CPI rate, real spending growth remains positive but lower than the nominal comparison.

Bishop Gold Group Explains the Difference Between Owning Gold and Having Exposure to Gold

As investors reconsider the role of precious metals in their portfolios, Bishop Gold Group says understanding what an investor actually owns may be just as important as deciding to gain exposure to gold in the first place.

Gold is often discussed as though it were a single investment category. In practice, however, there are several very different ways to participate in the gold market.

An investor might purchase physical coins or bars, buy shares of a gold-focused exchange-traded fund, invest in mining companies, or hold precious metals through certain retirement-account structures. Each may provide some connection to the gold market, but they do not necessarily provide the same ownership experience, risks, costs, or level of control.

According to Bishop Gold Group, understanding those distinctions is an important part of evaluating precious metals.

For investors considering gold as part of a broader diversification strategy, the first question may therefore be more specific than simply, “Should I own gold?”

It may be: “What exactly do I want to own?”

Gold Exposure Can Take Different Forms

One of the simplest distinctions is between owning physical gold and owning a financial instrument whose value is connected in some way to the gold market.

Physical gold generally refers to bullion products such as coins and bars. Once a transaction is completed, the buyer owns a tangible asset that must be delivered, stored, insured or otherwise safeguarded.

Other approaches can provide gold-related exposure without requiring the investor to personally take possession of metal. Exchange-traded products, for example, may allow investors to buy and sell shares through brokerage accounts. Gold-mining stocks provide another type of exposure, but their performance depends not only on the price of gold, but also on the financial and operational performance of the underlying companies.

These distinctions matter because two investors who both say they “invest in gold” may actually own fundamentally different assets.

Physical Ownership Changes the Relationship With the Asset

For some buyers, the tangible nature of physical gold is part of its appeal.

Unlike a stock or fund represented by an entry in a brokerage account, a gold coin or bar is a physical asset. Depending on the ownership arrangement, the owner may take direct possession or arrange for storage through a third party.

That tangibility can provide a degree of control that certain investors specifically seek. At the same time, it introduces responsibilities that do not necessarily exist with securities held electronically.

Physical gold must be securely stored. Insurance considerations may arise. Buyers should retain transaction and ownership records, understand applicable premiums and fees, and know how the asset could eventually be sold or transferred.

Bishop Gold Group emphasizes that these practical considerations should be understood before a transaction takes place rather than after the metal has already been purchased.

Convenience and Control Are Not Necessarily the Same Thing

Financial products connected to gold may offer conveniences that physical ownership does not.

Shares of publicly traded gold-related products can generally be bought and sold through brokerage platforms during market hours. Investors do not typically need to personally arrange transportation or physical storage of the underlying asset.

Physical gold works differently.

Buying or selling bullion may involve communicating with a dealer, receiving a quote, arranging payment or settlement, completing verification procedures, and coordinating delivery or storage.

Neither structure is inherently appropriate for every investor. Instead, the distinction illustrates an important tradeoff: the structure offering the greatest convenience may not necessarily provide the same form of ownership or control as possessing the underlying physical asset.

That difference can be particularly relevant for investors whose interest in precious metals is motivated by diversification beyond conventional financial accounts.

Investors Should Understand What They Are Trying to Accomplish

The appropriate form of gold exposure depends largely on the investor’s objective.

Someone interested primarily in short-term price movements may approach the market differently from someone purchasing physical bullion as a long-term holding. A retirement investor may face another set of considerations involving account structure, custodians, eligible precious metals, and storage requirements.

Before selecting a product, investors can consider several questions.

Do they want direct ownership of physical metal? How important is immediate liquidity? Are they comfortable arranging storage? What fees will apply when buying, holding, and eventually selling the asset? Is the objective short-term market exposure, long-term diversification, retirement planning, or tangible ownership?

Answering those questions can make it easier to compare options on their actual characteristics rather than treating every gold-related product as interchangeable.

Physical Gold Also Has Costs and Risks

Direct ownership should not be interpreted as eliminating investment risk.

Gold prices fluctuate, and physical gold does not ordinarily produce interest or dividends. Buyers may also pay premiums above the prevailing market price, along with potential shipping, insurance, storage, or administrative expenses.

When the metal is eventually sold, the price offered by a dealer or other buyer may differ from the price at which similar products are being sold to consumers.

These costs can affect the financial outcome of ownership and should be considered alongside the perceived benefits of holding a tangible asset.

Bishop Gold Group encourages consumers to understand the complete transaction, including pricing, premiums, storage arrangements, delivery procedures, and potential resale options, before making a purchase.

Education Becomes More Important as the Options Expand

The number of ways investors can gain exposure to gold makes financial literacy particularly important.

Consumers should understand whether they are purchasing physical metal, shares of a fund, stock in a mining company, or another gold-related financial product. They should also distinguish general educational information from individualized investment, tax or legal advice.

For physical precious metals, buyers can request written information regarding pricing, fees, delivery, storage, and resale procedures. Investors considering securities or retirement accounts should similarly review the applicable disclosures, expenses and regulatory requirements.

Gold has been owned and traded for centuries, but modern investors now have more ways to participate in the market than previous generations did.

That variety creates choice, but it can also create confusion.

For Bishop Gold Group, the distinction ultimately comes back to investor education. Understanding the difference between owning gold itself and owning something connected to gold allows consumers to evaluate the asset based on what they actually want from it.

For investors who value tangible ownership, physical gold may offer characteristics that financial products cannot replicate. For others, different forms of exposure may better fit their liquidity needs, risk tolerance, or financial objectives.

The important point is understanding the difference before making the decision.

Gold-related investments and physical precious metals involve risk and may lose value. Gold does not guarantee protection against inflation, market declines, or other financial losses. Investors should consider their individual circumstances and consult appropriately qualified financial, tax or legal professionals when necessary.

Disclaimer: This article is for informational purposes only and does not constitute financial, investment, tax or legal advice. Gold and other precious metals involve risk, may lose value and do not guarantee protection against inflation, market declines or other financial losses. Investors should evaluate their individual circumstances and consult qualified professionals before making investment decisions.

Allen Spearman Breaks Down the Journey from HVAC Journeyman to Master

At some point in an HVAC technician’s career, the work starts to feel different.

A service call that once required help from someone more experienced becomes one the technician can handle alone. An unfamiliar system is still unfamiliar, but the process for figuring it out isn’t. The technician knows which measurements to take, which questions to ask, and when an apparent solution doesn’t quite make sense.

That kind of confidence doesn’t necessarily arrive when someone earns a new license.

It develops over years spent working on equipment, making mistakes, seeing the same problems in different forms, and learning the trade by doing.

For Allen Spearman, that’s an important part of understanding the progression from apprentice to journeyman and eventually master. Licensing marks key stages in the process, but the bigger change is how much responsibility a technician is prepared to handle.

What the Apprenticeship Is Really Teaching

HVAC licensing requirements vary considerably by state and jurisdiction, but apprenticeship generally combines supervised field experience with technical instruction.

Early on, much of the learning is basic and practical.

An apprentice has to become comfortable with tools, job-site safety, equipment, and the routines that experienced technicians barely think about anymore. There is also a difference between understanding a refrigeration cycle in class and standing in front of a system that isn’t behaving the way the diagram says it should.

That gap is where a lot of the learning happens.

As apprentices gain experience, they begin doing more diagnostic work themselves. Low suction pressure, for example, doesn’t point automatically to one problem. Refrigerant charge, airflow, restrictions, and other conditions may need to be checked before the technician knows what’s actually happening.

The measurements start to mean more because the apprentice has seen what those numbers look like on real systems.

Administrative work also adds up. When licensing requires documented experience, technicians need to make sure their hours and other qualifications are recorded properly.

It’s a small habit that can matter years later, when they’re ready for the next step.

What Changes During the Journeyman Years

Earning a journeyman license can give a technician more independence, although exactly what that license permits depends on the jurisdiction.

The more interesting change happens in the work itself.

By this stage, a technician has usually encountered many of the same problems more than once. A condenser fan motor isn’t new anymore. Neither is a system with poor airflow or a unit installed in a way that makes an otherwise simple repair much harder.

Repetition gives technicians something a textbook can’t.

They begin recognizing patterns. They also learn when a familiar-looking problem isn’t behaving quite like the last one.

As Allen Spearman has written about the trade, these years are also when technicians begin establishing how they work when no one is standing over their shoulder.

Do they take the extra measurement? Do they check their initial diagnosis before replacing a part? If a repair doesn’t solve the problem, do they go back through the system methodically or start guessing?

Experience can make a technician faster, but it can also reinforce shortcuts.

Someone who becomes accustomed to sizing equipment by rule of thumb may keep doing it. A technician who routinely skips a diagnostic step because it usually isn’t necessary can eventually encounter the job where it was.

More independence makes those habits increasingly important because someone else may no longer be checking the work.

Preparing for the Master’s Exam

The step from journeyman to master introduces another set of responsibilities.

Requirements vary by location, but master-level licensing can require additional experience and exams covering areas such as mechanical codes, system design, business requirements, and overseeing permitted work.

That changes how a technician prepares.

A code book isn’t particularly useful if someone tries to memorize every page. Technicians need to understand how it is organized and become comfortable finding the section that applies to the problem in front of them.

Practice exams can help with that, especially when the test is timed.

Some of the habits developed through diagnosing systems under pressure carry over. When a technician doesn’t immediately know an answer, they still need a process for finding it.

Master-level responsibility can also extend beyond the technician’s own work.

Depending on local requirements and the type of license involved, a master may be responsible for permits or for work performed under their supervision. At that point, knowing how to complete a job correctly is only part of the responsibility.

The technician also has to know how to evaluate work completed by someone else.

Codes and Load Calculations Change the Work

One of the biggest changes at the master level is the attention paid to design.

Installing equipment that has already been specified differs from deciding what equipment to install in the first place.

That can mean working with Manual J load calculations, Manual D duct design, and Manual S equipment selection instead of relying on square footage or simply replacing an existing unit with another of the same size.

It also requires attention to ventilation, combustion air, condensate management, and applicable mechanical codes and local requirements.

These aren’t necessarily the parts of HVAC work customers notice.

They may notice the results, though.

A system has to heat or cool the building it serves, move air where it needs to go, manage humidity where that’s a concern, and operate without creating unnecessary comfort or performance problems.

Getting those decisions right before installation can prevent technicians from solving avoidable problems afterward.

Learning to Work Without Doing All of It Yourself

For technicians moving into supervisory or contractor roles, another adjustment has little to do with refrigeration or electrical systems.

They have to let other people do the work.

A technician who has spent years becoming good at a task may be able to complete it faster than the apprentice standing beside them. Taking over every time the apprentice struggles solves the immediate problem, but it doesn’t give that person much opportunity to improve.

Teaching requires a different kind of patience.

The same is true when managing experienced technicians. A person overseeing several jobs can’t personally diagnose every system, review every installation, answer every customer question, and still have time to run the rest of the work.

That means deciding what needs their attention and what someone else can handle.

For Spearman, this is one of the less obvious changes that comes with moving further up the trade.

Technical skill still matters. It just isn’t the only skill being used anymore.

Advice for Technicians Making the Climb

For technicians interested in moving from apprentice to journeyman and eventually toward master-level responsibility, a few habits can make the progression easier:

  • Log everything from day one. If a licensing board requires documented experience, keep those records while the work is happening.
  • Learn how to use the code book. Knowing where to find an answer is often more useful than memorizing everything.
  • Take the measurements. Static pressure, superheat, subcooling, combustion readings, and other diagnostic information can confirm whether the first assumption was actually right.
  • Ask experienced technicians questions. Seeing how someone else approaches an unfamiliar problem can shorten the amount of time it takes to develop your own process.
  • Give experience time to accumulate. Passing an exam and developing judgment aren’t necessarily the same thing.

The exact timeline varies because licensing rules, training programs, and career paths differ everywhere.

What doesn’t change as much is the amount of repetition involved.

A technician becomes more capable by working through one system, then another, and eventually realizing that today’s problem resembles something they struggled with years earlier.

The difference is that this time, they know where to start.

About Allen Spearman

Allen Spearman works in the heating, ventilation, and air conditioning field. He writes about the technical and career sides of the trade, with a particular focus on how technicians move from supervised work to independent responsibility.

His background building a career in the mechanical trades informs his commentary for apprentices and journeymen considering their next steps, including the changes in diagnostics, system design, and responsibility that come with greater experience in the field.