
Robotics and the Future of Safer Land Management Operations
Across industries that rely on heavy equipment and challenging terrain, workplace safety remains one of the most significant operational concerns. From forestry and vegetation management to land clearing and infrastructure maintenance, workers are often required to operate machinery in environments that present substantial risks. As robotics technology continues to advance, organizations are increasingly exploring how autonomous and remotely operated systems can help reduce these hazards while maintaining productivity.
Historically, land management and vegetation control have depended on human-operated equipment working in conditions that can include steep slopes, unstable ground, extreme weather, and remote locations. While advances in machine design and safety protocols have improved outcomes over the years, these environments continue to expose operators to potential accidents, injuries, and fatalities. According to the U.S. Department of Agriculture’s National Institute of Food and Agriculture (NIFA), agriculture ranks among the most dangerous professions in the United States, with consistently high rates of serious injuries and workplace fatalities. While advances in machine design and safety protocols have improved outcomes over the years, these environments continue to expose operators to substantial risk.
Industry reports across sectors involving heavy machinery consistently show that operator-related incidents remain a challenge. Fatigue, limited visibility, equipment rollovers, and human error can all contribute to workplace accidents. Tractor overturns, for example, remain among the leading causes of farm-related fatalities and disabling injuries. Research published by the University of Iowa reports that approximately one in seven farmers involved in tractor overturn incidents is permanently disabled, while seven out of ten farms cease operations within five years following a tractor-related fatality. As organizations seek ways to improve safety performance, automation is emerging as a practical solution rather than a purely experimental concept.
Robotic systems offer a fundamentally different approach to managing risk. Instead of placing operators directly in potentially hazardous environments, autonomous and remotely supervised machines can perform many of the same tasks largely without involving humans. This shift represents more than a technological advancement; it changes how organizations think about worker safety and operational planning.
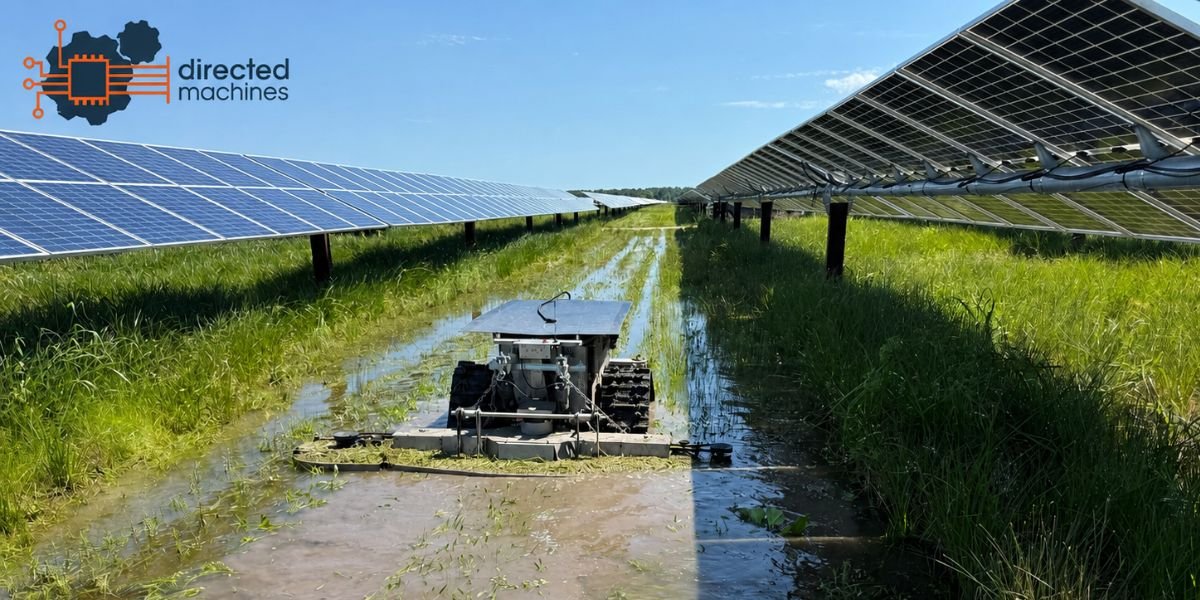
Companies developing autonomous land management technologies are increasingly focusing on applications where safety benefits are particularly meaningful. Tasks such as vegetation control, mowing, brush removal, and terrain maintenance often require equipment to operate in areas that may be difficult or dangerous for human operators to access. Even routine outdoor maintenance activities can present significant risks. According to Consumer Reports, more than 100 people die each year, and an estimated 143,000 people are seriously injured enough to require emergency-room treatment while performing tasks such as mowing lawns, trimming branches, or pressure washing. By allowing machines to navigate these environments independently, organizations can reduce direct human exposure to many common workplace hazards.
One of the most significant advantages of robotic systems is their ability to operate without experiencing fatigue. Human operators naturally face limitations related to concentration, physical endurance, and environmental stress. Long shifts, difficult terrain, and repetitive tasks can increase the likelihood of mistakes. Autonomous systems, when properly designed and monitored, can maintain consistent performance throughout operational cycles without being affected by these human factors.
Another important consideration is the ability of robotic platforms to collect and process environmental data in real time. Modern autonomous machines often utilize sensors, cameras, GPS technologies, and advanced software systems to evaluate their surroundings continuously. This capability can enable machines to detect obstacles, adjust routes, and respond to changing conditions more rapidly than traditional equipment operating methods.
The adoption of robotics also has implications for workforce development. Contrary to concerns that automation simply replaces workers, many organizations are finding that autonomous systems create opportunities for employees to transition into higher-value roles involving oversight, planning, maintenance, and system management. Instead of operating equipment directly in hazardous conditions, personnel can focus on supervising operations and making strategic decisions from safer environments.
For industries facing labor shortages, robotics may offer an additional benefit. Recruiting and retaining skilled operators for physically demanding and potentially dangerous work can be challenging. Autonomous technologies can help organizations address workforce constraints while continuing to meet operational requirements. In this context, robotics becomes both a safety solution and a workforce support tool.
Directed Machines is among the companies contributing to this broader shift toward automation in land management applications. By developing robotic systems designed to perform vegetation management and related tasks, the company is participating in an industry-wide effort to improve both operational efficiency and workplace safety. The growing interest in autonomous land management solutions reflects a wider recognition that technology can play a meaningful role in reducing risks traditionally associated with heavy machinery operations.
Looking ahead, the relationship between robotics and workplace safety is likely to become increasingly important. As autonomous technologies mature and gain wider acceptance, organizations may begin to view robotic systems not merely as productivity tools but as integral components of their safety strategies. The ability to remove personnel from hazardous environments while maintaining operational effectiveness represents a compelling value proposition across multiple industries.
While no technology can completely eliminate risk, robotics has the potential to significantly reduce many of the dangers associated with human-operated machinery. As innovation continues and adoption expands, autonomous systems may help establish a new standard for how land management and heavy-equipment operations are conducted, one where safety improvements are achieved not only through better procedures but through fundamentally rethinking the role of humans in hazardous environments.